The Dashboard is a Skrooge plugin that displays global information about your financial status.
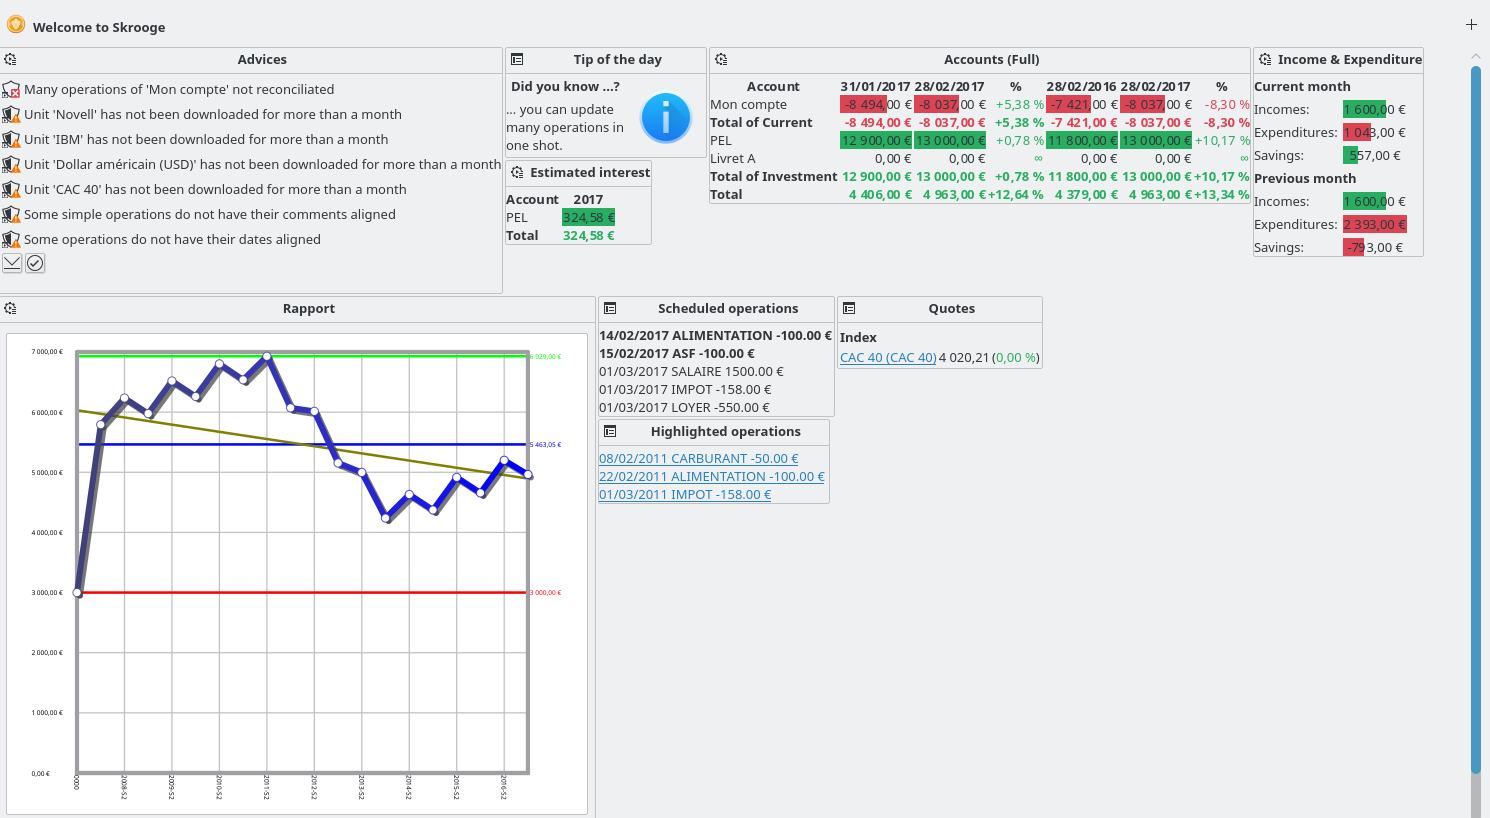
You can add new graphical items using button on the top right corner. You can configure each graphical item by clicking on the icon on it. You can organize the graphical items on the dashboard by using drag and drop.
Tip
Combined with bookmarks, this is a good way to have quick different views of your financial status.
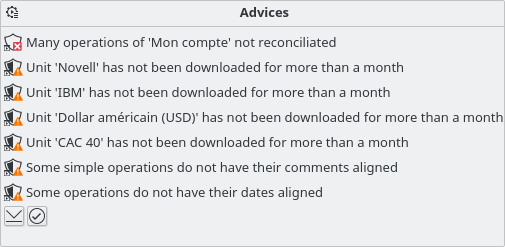
This graphical item displays some advice by order of priority. For each of them, you will be able to:
Open or clean concerned transactions
Dismiss this advice
Dismiss this advice for the current month
Dismiss this kind of advice
Dismiss this kind of advice for the current month
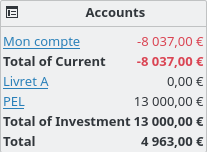
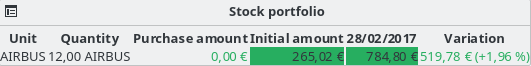
Display the balance of each account and type of account. You can configure this graphical item to select what you want to see.

Display the balance of each account and type of account. The balance can be compared with the balance one month before and one year before.
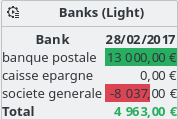
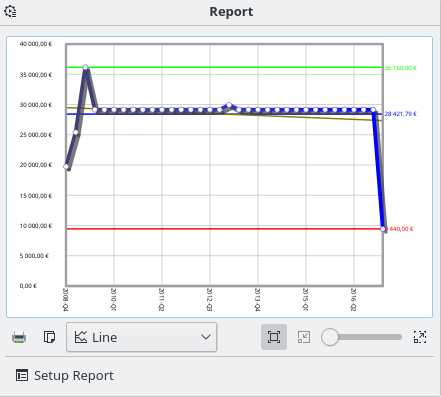
Display the balance of each bank. The corresponding report can be directly opened from the graphical item.
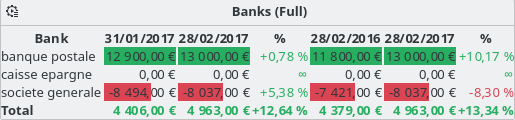
Display the balance of each bank. The balance can be compared with the balance one month before and one year before.
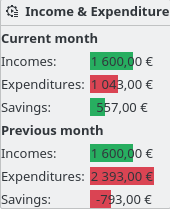
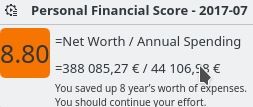
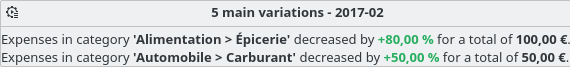
Display the incomes, expenditures and savings for two different periods (example: current month, current year, previous month, etc.). You can also:
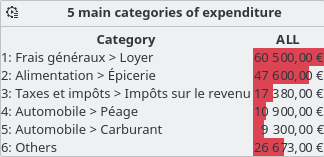
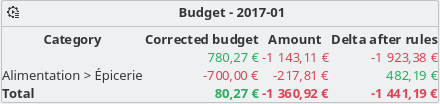
Display the five main categories of expenditure for the desired period.
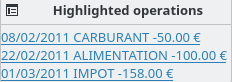
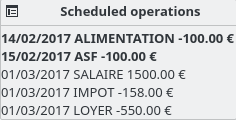
Display the alarms defined in Search and Process.
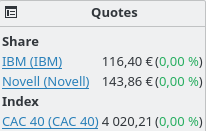
Display the quote of the defined units and the variations. You can choose the types of units to display.
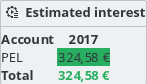
Display the estimation of interest for each account. You have to use the simulation page to define the rate of each account.