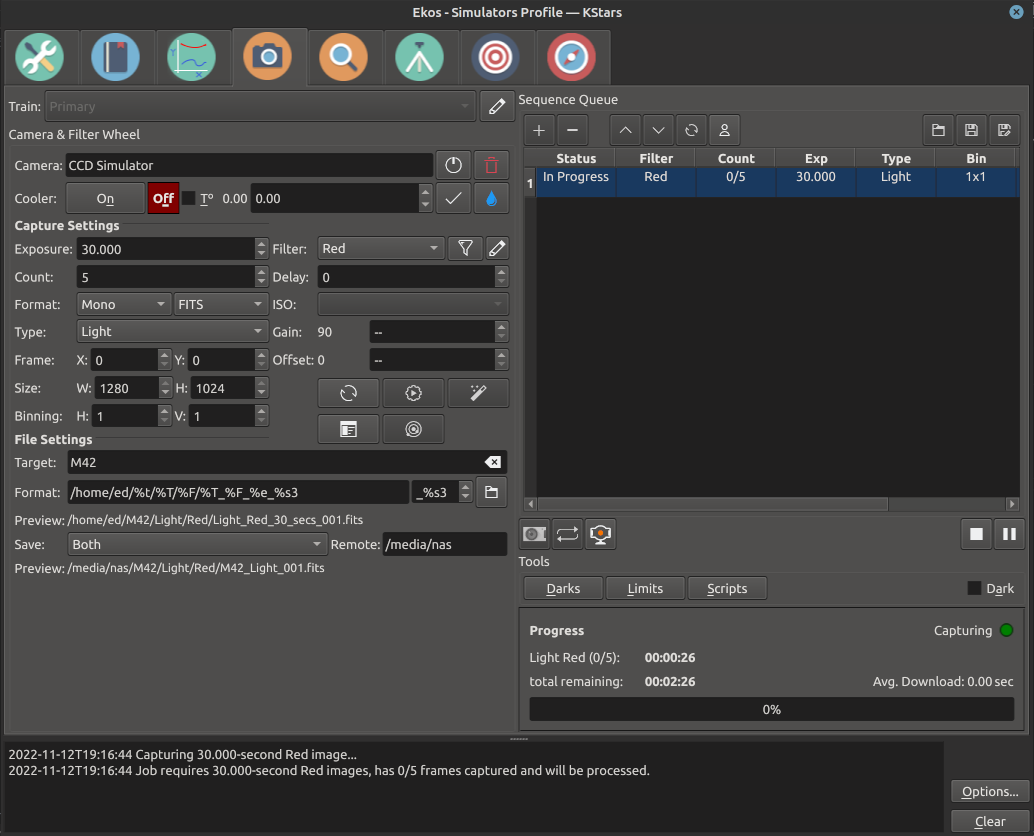
The Capture Module is your primary image and video acquisition module in Ekos. It enables you to capture single (Preview), multiple images (Sequence Queue), or record SER videos along with a selection of filter wheel and rotator, if available.
Select the desired CCD/DSLR and Filter Wheel (if available) for capture. Set CCD temperature and filter settings.
CCD: Select the active CCD camera. If your camera has a guide head, you can select it from here as well.
FW: Select the active Filter Wheel device. If your camera has a built-in filter wheel, the device would be the same as the camera.
Cooler: Toggle Cooler On/Off. Set the desired temperature, if your camera is equipped with a cooler. Check the option to force temperature setting before any capture. Capture process is only started after the measured temperature is within requested temperature tolerance. The default tolerance is 0.1 degrees Celsius but can be adjusted in Capture options under Ekos configuration.
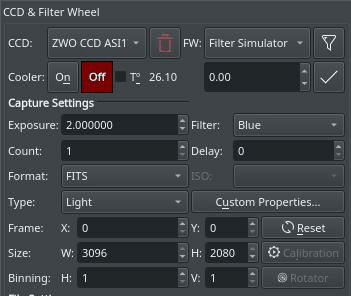
Set all capture parameters as detailed below. Once set, you can capture a preview by click on or add a job to the sequence queue.
Exposure: Specify exposure duration in seconds.
Filter: Specify the desired filter.
Count: Number of images to capture
Delay: Delay in seconds between image captures.
Type: Specify the type of desired CCD frame. Options are , , , and frames.
ISO: For DSLR cameras, specify the ISO value.
Format: Specify capture save format. For all CCDs, only option is available. For DSLR cameras, you can an additional option to save in format (e.g. RAW or JPEG).
Custom Properties: Set extended properties available in the camera to the job settings.
Calibration: For Dark &s; Flat frames, you can set additional options explained in the Calibration Frames section below.
Frame: Specify the left (X), top (Y), width (W), and height (H) of the desired CCD frame. If you changed the frame dimensions, you can reset it to default values by clicking on the reset button.
Binning: Specify horizontal (X) and vertical (Y) binning.
Many cameras offer additional properties that cannot be directly set in the capture settings using the common control. The capture controls described above represent the most common settings shared among different cameras, but each camera is unique and may offer its own extended properties. While you can use INDI Control Panel to set any property in the driver; it is important to be able to set such property for each job in the sequence. When you click , a dialog is shown divided into Available Properties and Job Properties. When you move an Available Properties to the Job Property list, its current value can be recorded once you click . When you add a job to the Sequence Queue, the properties values selected in the Job Properties list shall be recorded and saved.
The following video explains this concept is more detail with a live example:
Custom Properties feature

Settings for specifying where captured images are saved to, and how to generate unique file names in addition to upload mode settings.
Target: The name of the celestial target to be captured e.g. M42. Can be preloaded by the Scheduler Module and by selection with KStars.
Format: The Format string defines the path and filename of the captured images by the use of placeholder tags that are filled in with the selected item of data at save time.
A tag is identified by the % character. All tags have a single letter short form, and a self descriptive long form.
Arbitrary text may also be included within the Format string, except the % and \ characters. The / path character can be used to define arbitrary directories.
Note: Tags are case sensitive in both their short and long forms.
Available placeholder tags:
%f or %filename: The name of the sequence .esq file, without extension.
%D or %Datetime: The current time and date when the file is saved. Only use this tag in the filename portion of the format, not in the path portion.
%T or %Type: The frame type e.g. 'Light', 'Bias', 'Dark', 'Flat'...
%e or %exposure: The exposure duration in seconds.
%F or %Filter: The active filter name.
%t or %target: The Target name.
%s* or %sequence*: The image sequence identifier where * is the number of digits used (1-9). This tag is mandatory and must be the last element in the format.
Directory Browse Button: Opens a browse dialog to allow selection of the directory location used in the Format string. Use when first defining a Capture job.
Preview: Shows a preview of the resulting filename according to the Format string and other job settings.
Placeholder tags that are specified by the sequence .seq file can only be displayed once the sequence file has been saved.
The Datetime tag is previewed with the current system time and will be replaced by the time at point of image save.
The sequence tag is always previewed as image 1 in the sequence and will be automatically incremented when the job is in progress.
Upload: Select how captured images are uploaded:
Client: Captured images are only uploaded to Ekos and saved to the local directory specified above.
Local: Captured images are only saved locally on the remote computer.
Both: Captured images are saved on the remote device and uploaded to Ekos.
When selecting or , you must specify the remote directory where the remote images are saved to. By default, all captured images are uploaded to Ekos.
Remote: When selecting either or modes above, you must specify the remote directory where remote images are saved to.
Preview: Shows a preview of the resulting filename according the provided path job settings. The file name format for saving remotely is pre-defined, placeholder tags may not be used. The file sequence number is always previewed as image 1 in the sequence and will be automatically incremented when the job is in progress.
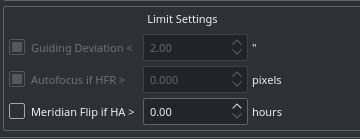
Limit settings are applicable to all the images in the sequence queue. When a limit is exceeded, Ekos shall command the appropriate action to remedy the situation as explained below.
Guiding Deviation: If checked, it enforces a limit of maximum allowable guiding deviation for the exposure, if autoguiding is used. If the guiding deviation exceeds this limit in arcseconds, it aborts the exposure sequence. It will automatically resume the exposure sequence again once the guiding deviation goes below this limit.
Autofocus if HFR >: If autofocus is enabled in the focus module and at least one autofocus operation was completed successfully, you can set the maximum acceptable HFR value. If this option is enabled then between consecutive exposures, the HFR value is recalculated, and if found to exceed the maximum acceptable HFR value, then an autofocus operation is automatically triggered. If the autofocus operation is completed successfully, the sequence queue resumes, otherwise, the job is aborted.
Meridian Flip: If supported by the mount, set the hour angle limit (in hours) before a meridian flip is commanded. For example, if you set the meridian flip duration to 0.1 hours, Ekos shall wait until the mount passes the meridian by 0.1 hours (6 minutes), then it commands the mount to perform a meridian flip. After the meridian flip is complete, Ekos re-aligns using astrometry.net (if the alignment was used) and resumes guiding (if it was started before) and then resumes the capture process automatically.
Sequence Queue is the primary hub of the Ekos Capture Module. This is where you can plan and execute jobs using the sequence queue built-in powerful editor. To add a job, simply select all the parameters from the capture and file settings as indicated above. Once you selected your desired parameters, click on the add button  in the sequence queue to add it to the queue.
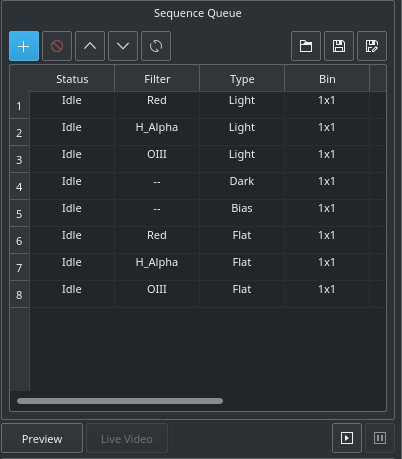
You can add as many jobs as desired. While it is not strictly necessary, it is preferable to add the dark and flat jobs after the light frames. Once you are done adding jobs, simply click Start Sequence  to begin executing the jobs. A job state changes from Idle to In Progress and finally to Complete once it is done. The Sequence Queue automatically starts the next job. If a job is aborted, it may be resumed again. To pause a sequence, click the pause button
  and the sequence will be stopped after the current capture is complete. To reset the status of all the jobs, simply click the reset button
  . Please beware that all image progress counts are reset as well. To preview an image in KStars FITS Viewer, click the button.
Sequence queues can be saved as an XML file with extension .esq (Ekos Sequence Queue). To load a sequence queue, click the open document button  . Please note that it will replace any current sequence queues in Ekos.
Important
Job Progress: Ekos is designed to execute and resume the sequence over multiple nights if required. Therefore, if Remember Job Progress option is enabled in Ekos Options, Ekos shall scan the file system to count how many images are already completed and will resume the sequence from where it was left off. If this default behavior is not desired, simply turn off Remember Job Progress under options.
To edit a job, double click it. You will notice the add button  now changed to check mark button
  . Make your changes on the left-hand side of the CCD module and once done, click on the check mark button. To cancel a job edit, click anywhere on the empty space within the sequence queue table.
Important
Editing running jobs: When Capture is running, or when the Scheduler is running, you cannot edit the sequence queue or a .esq file on disk using the Capture tab. However, the scheduler tab does have a Capture Sequence Editor tool that can be used to edit .esl files on disk, or create new ones.
If your camera supports live video feed, then you can click the button to start streaming. The video stream window enables recording and subframing of the video stream. For more information, check the video below:
Recording feature
The live view also provides a graphical overlay tool to aid in collimation. This is toggled on/off by the crosshair button.
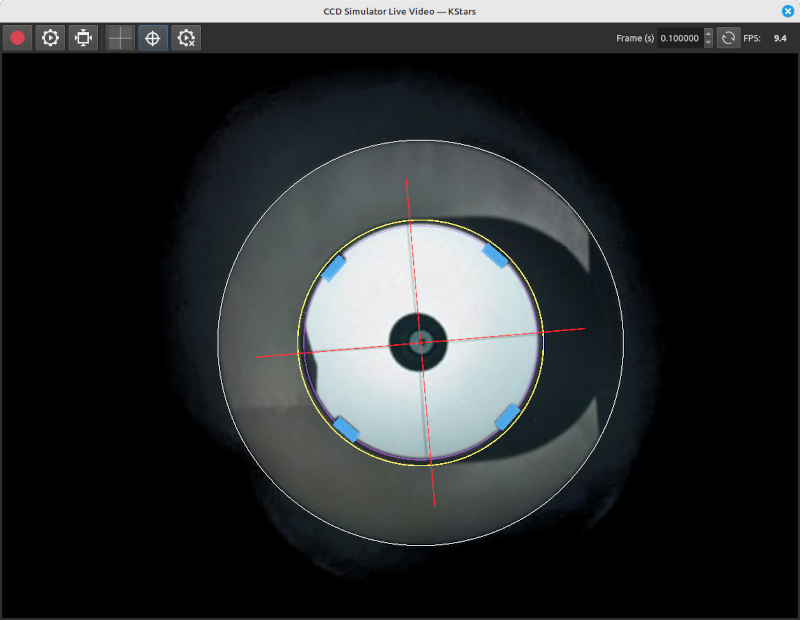
Collimation overlay
The overlay options button opens a dialog that allows arbitrary and flexible creation of ellipses (including circles), rectangles and lines, as well as anchor points which act as global drawing offsets. Each defined element has its own size, offset, repetition, thickness and color (including transparency).
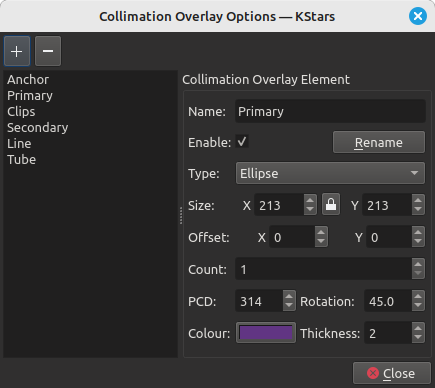
Collimation overlay options
Captured images are displayed in KStars FITS Viewer, and also in the summary screen. Set options related to how the images are displayed in the viewer.
Auto Dark: You can capture an image and auto dark subtract it by checking this option. Note that this option is only applicable when using Preview, you cannot use it in batch mode sequence queue.
Effects: Image enhancement filter to be applied to the image after capture.
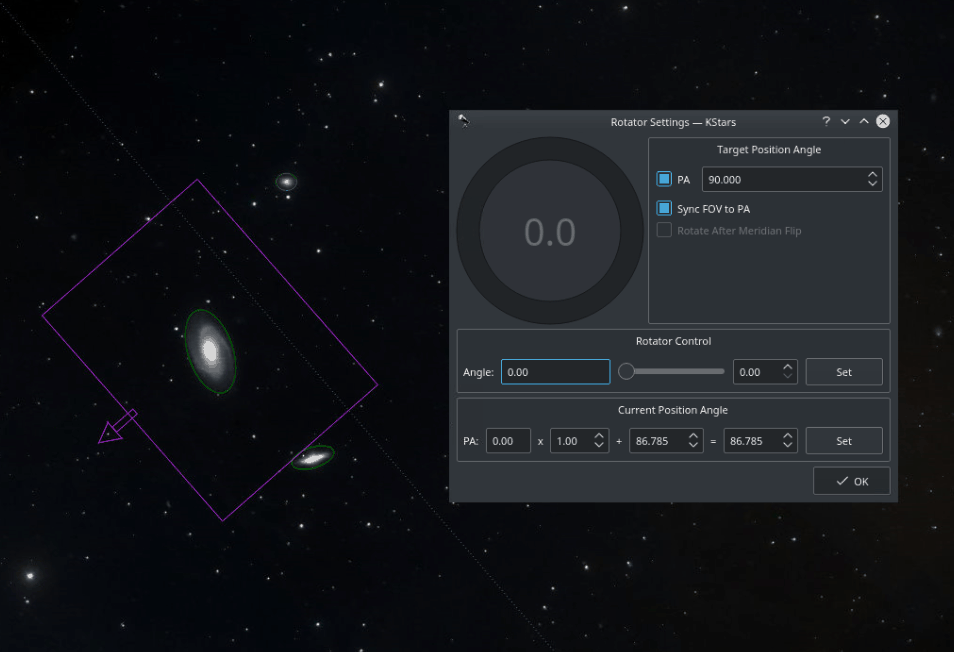
Field Rotators are supported in INDI & Ekos. The rotator angle is the raw angle reported by the rotator and is not necessary the Position Angle. A Position Angle of zero indicates that the frame top (indicated by small arrow) is pointing directly at the pole. The position angle is expressed as E of N (East of North), so 90 degrees PA indicates the frame top points 90 degrees away (counter-clockwise) from the pole. Check examples for various PAs.
To calibrate the Position Angle (PA), capture and solve an image in the Ekos Align module. An offset and a multiplier are applied to the raw angle to produce the position angle. The Ekos Rotator dialog permits direct control of the raw angle and also the PA. The offset and multiplier can be changed manually to synchronize the rotator's raw angle with the actual PA. Check Sync FOV to PA to rotate the current Field of View (FOV) indicator on the Sky Map with the PA value as you change it in the dialog.
Rotator settings
Each capture job may be assigned different rotator angles, but be aware that this would cause guiding to abort as it would lose track of the guide star when rotating. Therefore, for most sequences, the rotator angle is kept the same for all capture jobs.
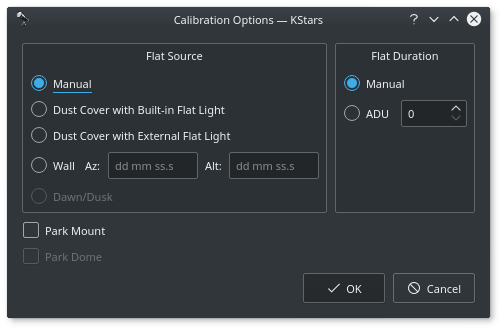
For Flat Field frames, you can set calibration options in order to automate the process. The calibration options are designed to facilitate automatic unattended flat field frame capture. It can also be used for dark and bias frames if desired. If your camera is equipped with a mechanical shutter, then it is not necessary to set calibration settings unless you want to close the dust cover to ensure no light at all passes through the optical tube. For flat fields, you must specify the flat field light source, and then specify the duration of the flat field frame. The duration can be either manual or based on ADU calculations.
Flat Field Source
Manual: The flat light source is manual.
Dust Cover with Built-In Flat Light: If using a dust cover with builtin light source (e.g. FlipFlat). For dark and bias frames, close the dust cap before proceeding. For flat frames, close the dust cap and turn on the light source.
Dust Cover with External Flat Light: If using a dust cover with an external flat light source. For dark and bias frames, close the dust cap before proceeding. For flat frames, open the dust cap and turn on the light source. The external flat light source location is presumed to be the parking location.
Wall: Light source is a panel on the observatory wall. Specify the Azimuth and Altitude coordinates of the panel and the mount shall slew there before capturing the flat field frames. If the light panel is controllable from INDI, Ekos shall turn it on/off as required.
Dawn/Dusk: Currently unsupported.
Flat Field Duration
Manual: Duration is as specified in the Sequence Queue.
ADU: Duration is variable until specified ADU is met.
Before the calibration capture process is started, you can request Ekos to park the mount and/or dome. Depending on your flat source selection above, Ekos will use the appropriate flat light source before starting flat frames capture. If ADU is specified, Ekos begins by capturing a couple of preview images to establish the curve required to achieve the desired ADU count. Once an appropriate value is calculated, another capture is taken and ADU is recounted until a satisfactory value is achieved.
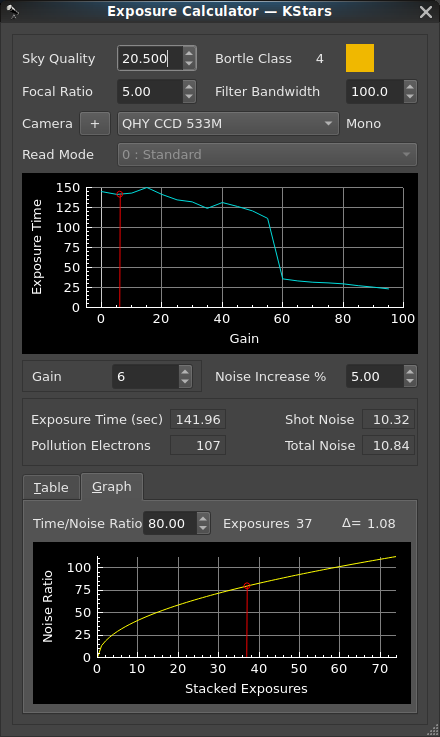
The exposure calculator is an implementation of a calculation process presented by Dr. Robin Glover in 2019. This calculation process seeks to establish a sub-exposure time which considers two sources of noise in an image: camera read noise, and noise from background sky brightness (light pollution). The effects of camera thermal noise on images is not considered in this calculation. (Note: Since his presentation in 2019, Dr. Glover has enhanced his calculation process to incorporate the effects of sensor quantum efficiency, and sensor pixel size. At this time, the KStars implementation lacks those features.)
The concept in Dr. Glover's calculation is to provide a sufficiently long exposure so that the effects of camera read-noise are overwhelmed by the signal coming from the target, but not so long an exposure that the effects of light pollution rise to levels which would overwhelm the signal from the target.
The implementation of this process does not consider the strength (magnitude or flux) of the intended target, nor does it consider other factors which may cause an astrophotographer to choose an alternate sub-exposure time. These other factors may include: the storage requirements and extended post-processing time for a large number of short exposures, the impacts of external factors that might occur in very long exposures, such as tracking / guiding performance, changes in weather conditions which may disrupt seeing conditions, intrusions from air traffic or passing satellites.
Approaches to imaging can vary greatly in the selection of exposure times, and number of sub-exposures used for integration. A well accepted approach for imaging deep-sky objects utilizes long exposures, requires good guiding, good to excellent seeing conditions, and would typically employ filtering to reduce the effects of light pollution. At the other extreme are approaches such as speckle imaging techniques (commonly 'lucky imaging'), which utilize many hundreds to many thousands of extremely short exposures in an attempt to eliminate the effects of light pollution, poor seeing conditions, and poor guiding. Choices made for values of certain inputs to the exposure calculator will vary depending upon which imaging approach is being employed.
Exposure Calculator Inputs
Sky Quality: The sets the measurement of the magnitude per square arc-second of the background sky.
The range for Sky Quality is from 22 for the darkest skies, to 16 for the brightest (most light-polluted) skies. The magnitude scale is non-linear; it is a logarithmic scale based on the 5th root of 100. So 5 steps on the scale represent a change in brightness by a factor of 100. (A Sky Quality of 17 is 100 times as bright as a Sky Quality of 22. Each full integer step on the scale is a change by a factor of approximately 2.512.). Wikipedia Sky Brightness Wikipedia Light Pollution
All light scattered in the background sky is considered to be light pollution regardless of its source, so the effects of moonlight should be considered as "natural" light pollution. But weather conditions can also impact Sky Quality, as humidity or cloud cover can reflect and scatter any source of light through the atmosphere
A Sky Quality Meter (SQM) can provide the most accurate reading of sky quality if used during an imaging session, but an estimated value from sky quality surveys may also be found on the web at sites such as www.lightpollutionmap.info or www.clearoutside.com. But these on-line sources for estimated light pollution generally do not account for the effects of moonlight or local weather conditions. So the values from light pollution web sites should only be considered as a “best case scenario” for a cloudless night during a new moon.
If a light pollution map value is used for the input value of SQM, but imaging will be performed with a partial moon, then a decrease in the input of the SQM value should be applied in the calculator. Moonlight can be overwhelming; at a location where a light pollution map showed an SQM value of 19.63. An SQM reading was made on a night with a waxing crescent, shortly before half-moon, (moon age 5.4, and KStars moon magnitude = -10). The SQM reading at zenith showed the sky to be much brighter with measured value of 18.48. A reading taken on a night with a waxing gibbous, shortly before a full moon, (moon age 12.4, and KStars moon magnitude = -12). The SQM reading at zenith showed a measured SQM value of 15.95.
The value of Sky Quality has a drastic impact on the calculated exposure because of the logarithmic scale involved. An image taken from a location with heavy light pollution (a low sky quality value), especially when filtering is not applied, may result in a very short exposure time to prevent light pollution from overwhelming the target signal. An image taken from a location with very little light pollution (a high Sky Quality value) may result in an sub-exposure time of several hours.
Focal Ratio: The selector for sets the value from the optical train, which is needed for the evaluation of light gathering capability.
The value of the focal ratio of the optic has a direct effect on the exposure calculation. A lower focal ratio is considered to be a "faster optic" as it has a greater light gathering capability than an optic with a longer focal ratio. So the exposure calculation will be reduced when a lower focal ratio is used, and increased when a higher focal ratio is used.
The user might consider making a slight adjustment to the input value of the focal ratio to compensate for the efficiency or for obstructions in the optic.
For example, two optics of the same focal ratio, a refractor (with no obstruction) and a reflector (with a secondary mirror obstruction) would be treated as equivalent optics in the computations. One way that a user might compensate for this would be to make an adjustment to the focal ratio input value to compensate for the efficiency of the optic. A refractor is generally considered to have an efficiency of about 94%, a reflector is generally considered to have an efficiency of about 78%.
An effective / adjusted focal ratio value for a refractor = Optic Focal Ratio / 0.94
An effective / adjusted focal ratio value for a reflector = Optic Focal Ratio / 0.78
These adjustments slightly increase the focal ratio, and therefore slightly reduce the computed light gathering capability considered in the calculation.
Filter Bandwidth: The selector for sets the value for the bandwidth (in nanometers), and should be reduced from the default value of 300 when a filter is included in the optical train. The inclusion of filters in the optic train will greatly effect the exposure calculation. The value ranges from 300, for imaging without any filter, down to 2.8 for an extreme narrow-band filter.
Filters fall generally into two categories: single band, or multi-band. The bandwidth for a single band filter should be relatively easy to determine or estimate. Generally a Red, Green or Blue filter is considered to have a bandwidth of 100 nanometers. Documentation of narrow-band filters will frequently state the bandwidth (usually in the range of 3 to 12 nm). But the bandwidth of multi-band astronomy filters, such as light-pollution filters, or filters specifically designed for use on nebulae may be more difficult to determine as their transmission profiles can be far more complex.
Even within the bands that filters are intended to pass, filters are not 100% efficient. So a user of the calculator might wish to slightly reduce the value of the filter bandwidth to compensate for this. Example: if a filter is presumed to have a bandwidth of 100 nm but its transmission efficiency is only 92%, then a value of 92 might better represent this filter, and result in a slightly more accurate exposure calculation.
The value of the filter bandwidth has an inverse effect on the exposure calculation. An unfiltered exposure would use the max value of 300 for the filter bandwidth (representing visible spectrum of 300 nanometers), and will produce the shortest exposure time calculation. An extreme narrow-band filter, (for example a 3 nanometer bandwidth), will produce the longest exposure time.
Camera: The exposure calculation requires a value for the read noise of the camera. Camera read noise is an electronic noise that occurs at the completion of an exposure as the camera is measuring the analog voltage values of the pixels and converting these measurements into digital values. Read noise is not effected by the length of an exposure.
Camera sensors are one of two types: "Charge Coupled Device" (CCD) or "Complementary Metal-Oxide Semiconductor" (CMOS). For the exposure calculation the main difference between these sensor types is that CCD sensors do not have a variable gain setting that would impact the read noise; so a CCD sensor will have a single constant value for its read noise. A CMOS sensor does have a variable gain (or ISO value), and changes to that setting usually result in a change to the read noise.
The exposure calculator relies upon the selection of a camera data file so that it can access an appropriate read noise value for use in the calculation. The camera selection drop down allows the user to select an appropriate camera data file. For a CCD camera the file will only hold a single read noise value, but for a CMOS camera the file includes a table (or a few tables) of values which relate the gain or ISO value to a read noise value. Do not be confused by "CCD" appearing in the names of many dedicated astrophotography cameras, most of these cameras are using CMOS sensors.
The camera data files provided in KStars contain values which are transcribed from manufacturers technical documentation. But actual read noise values for a camera may vary from the published data; so a user may which to utilize a tool that can determine the read noise values for their specific camera. Dr. Glover provides a sensor analysis tool in his MS-Windows based product SharpCap SharpCap Sensor Analysis The specific data from such a tool can be used to create a customized camera data file for use with the KStars exposure calculator.
Read Mode: Some cameras manufactured by QHY have the capability to function in multiple modes. These modes alter the read noise values, so the camera data files for these cameras include multiple read noise tables. When using one of these multi-mode cameras the Read Mode dropdown will become enabled, and allow the user to select the read mode table that would correspond to the mode in which the camera will be operated for imaging.
: The calculator will present a graph of the potential exposure times determined from the inputs. In the case of CMOS based cameras, this graph will resemble the underlying read noise data from the camera, but is transformed into an exposure time over the range of possible gain or ISO values. In the case of CCD based cameras, the graph will be a simple bar, because the read noise of a CCD sensor is invariable.
Gain / ISO Selection: For cameras with CMOS sensors, a Gain or ISO value can be selected. A Gain control will appear for cameras that allow a gain selection, and an ISO selection drop down will appear for DSLR cameras. Adjusting the gain / ISO value will move a selection indicator laterally along the exposure time graph to show how the selected gain value will effect the calculated exposure time.
CMOS based cameras tend to have high read noise at low gain / ISO values, and the read noise diminishes as the Gain / ISO value is increased. So a user might be tempted to select a higher gain value in an attempt to reduce the amount of read noise. But the camera full well capacity would typically be highest when gain / ISO values are lowest. A greater full well capacity provides a greater dynamic range in the image.
Selection of a gain / ISO value would be dependent upon the imaging technique being employed. When a long exposure is desired (as with 'typical' DSO imaging), then a low gain / ISO value would usually be preferred to achieve a greater dynamic range in the image. But if a speckle technique ('lucky imaging') is being used, the exposure times would be so low that reducing read noise becomes critical, in such a case the user would likely prioritize a low read noise in the sub-exposures, and will likely need to select a high gain/ISO value.
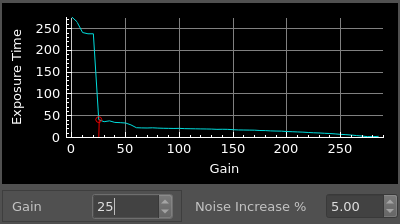
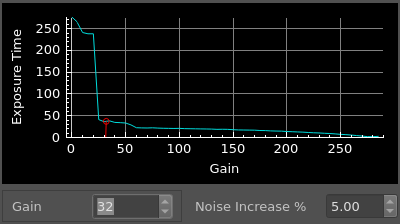
Some cameras may show a smooth progressive curve in the read-noise over the range of gain values, other cameras may have very pronounced steps (and other anomalies) in their read-noise. These pronounced steps are usually the result of electronic mode switching within the camera. In cases where the graph shows a pronounced step, the user may wish to select a gain value which is at the bottom of that step. This may provide a reduced read noise, and result in a shorter exposure without a significant loss in dynamic range when compared to an image shot at a gain selection that is at the top of that step. But caution is needed when selecting a gain near a “step” on the graph. Some posts on forums indicate that the read-noise data provided by manufacturer documentation may not be exact. The actual “switch” in read-noise may be at a slightly higher or lower gain value, so it is recommended to avoid selecting a gain value that is at a step in read noise.
When using data from camera manufacturer documentation, avoid selecting a gain near a step
Instead, shift the gain selection away from the step
Noise Increase %: The selector controls a factor used in Dr Glover's equation. This value will alter the relative balance between the two sources of noise in the sub-exposure. As a general rule, Dr Glover had recommended using a value of 5%, but lowering it to 2% when the computed exposure time is considered to be too short.
The perspective of the "increase" is a relative increase in read-noise compared to noise from light pollution. It may seem counter-intuitive, but raising the value of 'Noise Increase %' will reduce the exposure time, reducing the noise from light pollution (and reducing the target signal), so the 'increase' means a relative increase in the effect of the read noise compared with the pollution noise. Lowering the value of 'Noise Increase %' will increase the exposure time, and will allow more noise from light pollution, (and more target signal), into the exposure. This effectively reduces the relative impact of read-noise.
In this implementation of the calculator, the value for the 'Noise Increase %' can be set to in a very broad range to allow a user a greater range for experimentation. But a user should recognize that large changes to this value can have undesired consequences. Forcing an exposure time down may cause the exposure to carry a relatively heavy burden from read noise, and would reduce the quality of the sub-exposure, (the ratio of exposure time to total noise will fall). As a result a significantly higher number of exposures for integration would be needed to achieve an acceptable level of quality. Forcing an exposure time up to long exposure might cause the exposure to have excessive noise from light pollution.
The value selected for the 'noise increase %' is also one which is dependent upon the imaging technique being employed. When a speckle technique ('lucky imaging') is being employed, the user will likely need to force the exposure time down to an extremely short duration (sub-second exposures are standard with this technique). So the user may need to drastically raise the value of 'noise increase %' to reduce the time of the sub-exposure down to the durations demanded by this technique.
Exposure Calculator Results
Exposure Time (sec): The calculated duration of an exposure.
Pollution Electrons: The calculated number of light pollution electrons per pixel impacting the exposure.
Shot Noise: The calculated noise from light pollution impacting the exposure.
Total Noise: The calculated noise from both light pollution and image sensor read noise impacting the exposure.
Important
Recognize the relationship of exposure time to total noise: The ratio of exposure time to exposure total noise can be thought of as a measurement of a potential quality for the exposure. Short exposures will contain a high amount of noise relative to their exposure time, so a shorter exposure would tend to be of relatively lower quality. Short exposures may still be viable, but a disproportionately higher number of short sub-exposures will be needed for integration to achieve an image of a desired quality.
Stacking / Image Integration Information
The value of image stacking is that as images are stacked, the accumulation of exposure time and the data that represents the target signal is increased proportionally with the added number of images being integrated, but the increase in noise is disproportionally lower. As a result, the quality of integrated images can be seen as curve which starts with a good “yield” when the first few sub-exposures are integrated, but this curve has diminishing returns as the number of sub-exposures being integrated is increased.
Ideally a desired signal to noise ratio (SNR) would be used for the measure of the level of quality of an image, but the exposure calculator does not possess an ability to recognize the strength of the signal from an intended imaging target, so it cannot calculate an estimated signal to noise ratio. So the level of quality to be specified in the stacking calculation is the integration time in seconds divided by the calculated noise in the integrated image, (a “Time/Noise Ratio”). For the purposes of the calculation, the “Time/Noise Ratio” can be considered as a partial analog to a signal to noise ratio. But the user must recognize that a specified time to noise ratio is not an absolute measure of the quality of all integrated images from all targets because a signal strength (magnitude or flux) is not part of this calculation.
: A table provides details for stacking based upon the number of hours planned for imaging.
The table provides a quick reference for finding the approximate number of sub-exposures that might be completed for a given number of hours in an imaging session. But some functions that consume time are not included in this time calculation. For example, USB based cameras typically take some time for data transmission, or if the user has selected automatic dithering, additional time will be consumed in the imaging process, which is not included in this time calculation.
The far right column of the table shows the calculated time/noise ratio of the integrated (stacked) image that would be produced.
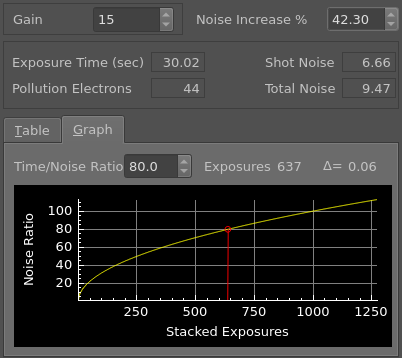
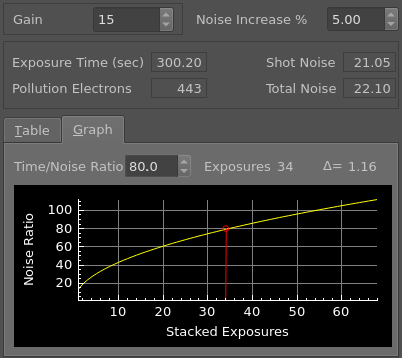
: An interactive graph allows the user to visualize the relative change in potential quality for integrated images with various counts of sub-exposures applied in image stacking. This graph can be navigated through the adjustment of the time/noise ratio value; adjusting this value will recompute the quantity of sub-exposures required for the integrated image to achieve that specified time/noise ratio.
In the selection of a Time/Noise ratio for the calculation of the count of stacked exposures, the user might want consider the incremental change to the potential quality of the image from an additional sub-exposure. To help a user assess the value of increasing the number of sub-exposures for integration; the tool includes a calculation of the slope for the selected point on the time/noise curve (the user interface uses a delta symbol to present this value). This delta value represents the change in potential quality that will result from the addition or subtraction of a single sub-exposure.
As one should expect, at the low-end of exposure counts (when a low value for the Time/Noise Ratio is input), the delta value will be relatively high, so the addition of one image will provide a relatively large improvement to the integrated image. But as a user increases the value for the Time/Noise Ratio, more images will be included for integration, and the delta value will fall, indicating that there is less to be gained from adding more sub-exposures.
The default value for the time / noise ratio is set to 80. This value should not be construed in any way as an optimal value; it was simply chosen as a somewhat average value. A user should consider a few factors when adjusting the value of the time / noise ratio: 1) the strength of the target object, 2) the time / noise ratio of the calculated sub-exposure, 3) the limitations of time for imaging and processing, and limitations of storage capacity for the images.
For a strong target, (example, Orion Nebula with magnitude 4), would provide a relatively strong signal. On such a target, the value for the Time/Noise Ratio might be reduced and the computation of sub-exposures, may still produce an image with a very good signal to noise ratio. A much weaker target (example, Thor’s Helmet, magnitude 11), might require a higher time/noise ratio to compensate for the relatively weak target signal.
Depending on the various inputs and imaging conditions, the potential quality of a sub-exposure can vary greatly. In poor sky quality with little or no filtering, the computed sub-exposure time will naturally be short to avoid an overwhelming noise from light pollution, and the exposure time relative to the computed noise will be low (a low time/noise ratio). To achieve a high quality integrated image from low time/noise ratio sub-exposures may require thousands sub-exposures. If the user is concerned about imaging and processing time or storage capacity; then a higher time/noise ratio would needed to reduce the quantity of sub-exposures. Conversely, when input conditions result in a sub-exposure with a long exposure time relative to the computed noise (as with narrow-band imaging), the result may be a sub-exposure with a very high time/noise ratio. In such cases the default value of 80, might result in very few sub-exposures for the integration. But the delta value will be quite high, indicating that raising the time-noise ratio will greatly improve the potential quality of the integrated image.
Part of the value of using a Time/Noise ratio as the input for the calculation of the required number of sub-exposures is that it should tend to compensate for the differences in relative noise for sub-exposures of various lengths. A shorter sub-exposure would have a lower time/noise ratio, so it has less capacity to improve an integrated image. Therefore, a disproportionately higher number of short exposures are needed to achieve a given time/noise ratio in an integrated image.
As an example, consider the calculation of the number of sub-exposures required when two sub-exposures times were compared: a 300 second sub-exposure vs a 30 second sub-exposure. The 300 second sub-exposure had a calculated noise of 22.1, resulting in a sub-exposure time/noise ratio of 13.6. When the 'noise increase %' is raised to force the exposure time down to 30 seconds, we see a calculated noise of 9.47, resulting in a much lower sub-exposure time/noise ratio of 3.2. The 300 second exposure is of significantly higher potential quality than the 30 second exposure. We will demand the default time/noise ratio of 80 for integration in both of these cases.
For an integration using the 300 second sub-exposures we find that 34 sub-exposures are required to achieve a time/noise ratio of 80. So a total integration time of 2.83 hours is required.
For an integration using the 30 second sub-exposures we find that 637 sub-exposures would be required to achieve a time/noise ratio of 80. So a total integration time of 5.31 hours is required with these shorter exposures to achieve the same time/noise ratio in the integrated image.
