Table of Contents
In this chapter you will find explanations on how to build a simple plot for a curve in the Cartesian coordinates from a mathematical equation.

Click on the button or press Ctrl+N on the keyboard.

Click on the Project item on the Project Explorer panel with the mouse button and choose → or press Alt+X on the keyboard.
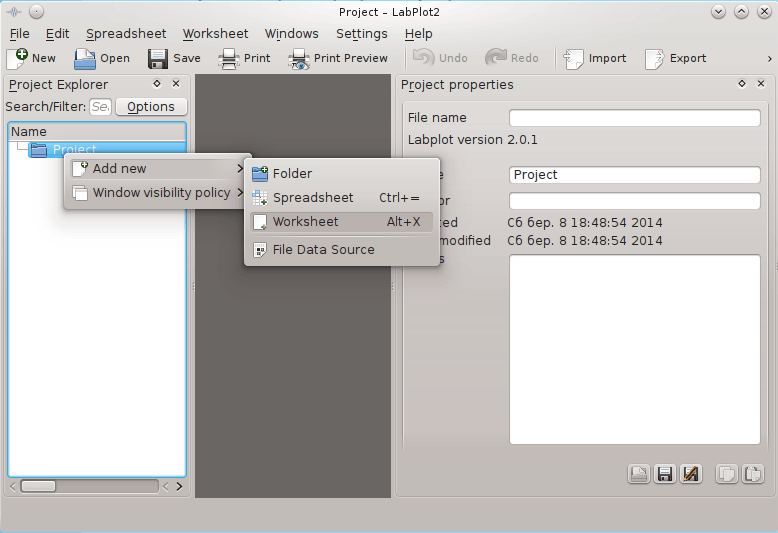
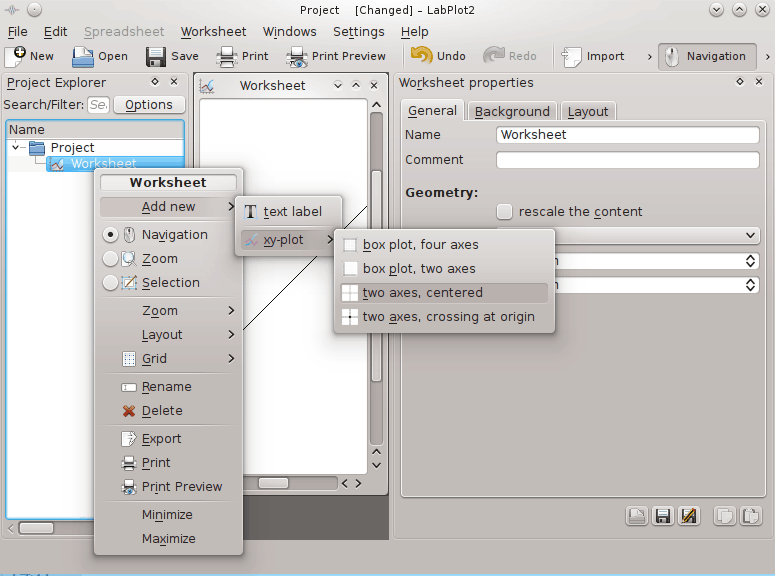
Click on the Worksheet item on the Project Explorer panel with the mouse button and choose → → .
Click on the xy-plot item on the Project Explorer panel with the mouse button and choose → .
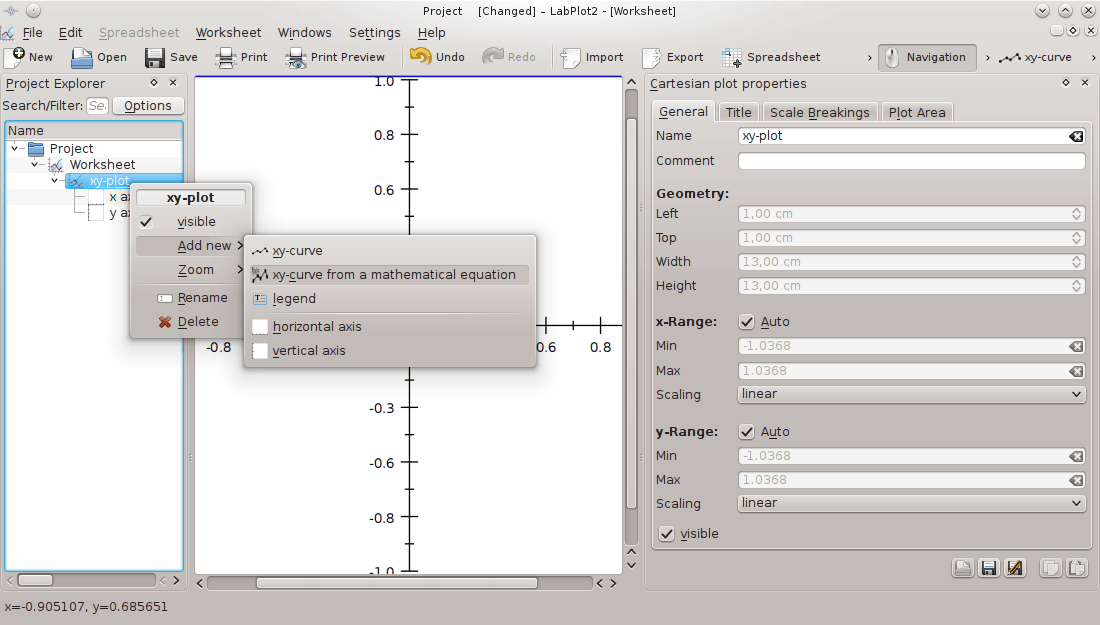
Use the xy-equation-curve properties pane on the right to enter
sin(x)into the y=f(x) field (for the list of available functions please see Chapter 10, Parser functions),-6into the x, min field,6into the x, max field and click on the button to see the result.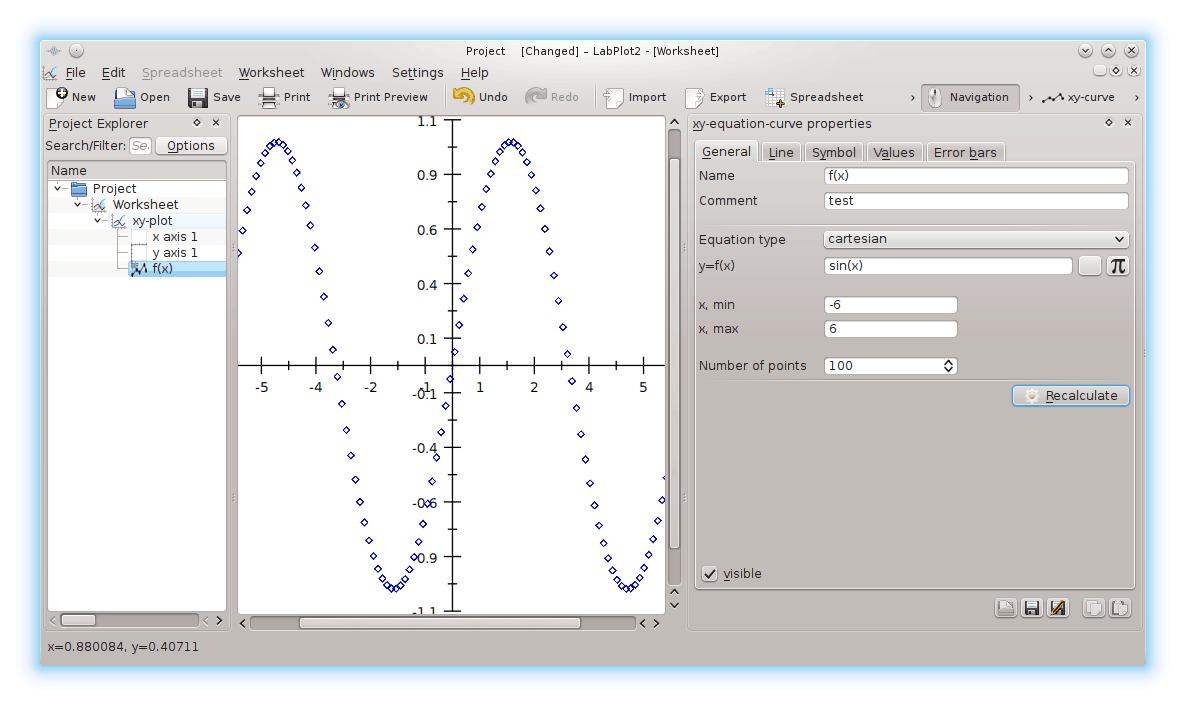
Note
LabPlot highlights unknown syntax in the y=f(x) field. This is useful to control the correctness of the input.
Important
The list of the known functions can be found in corresponding section of this manual.
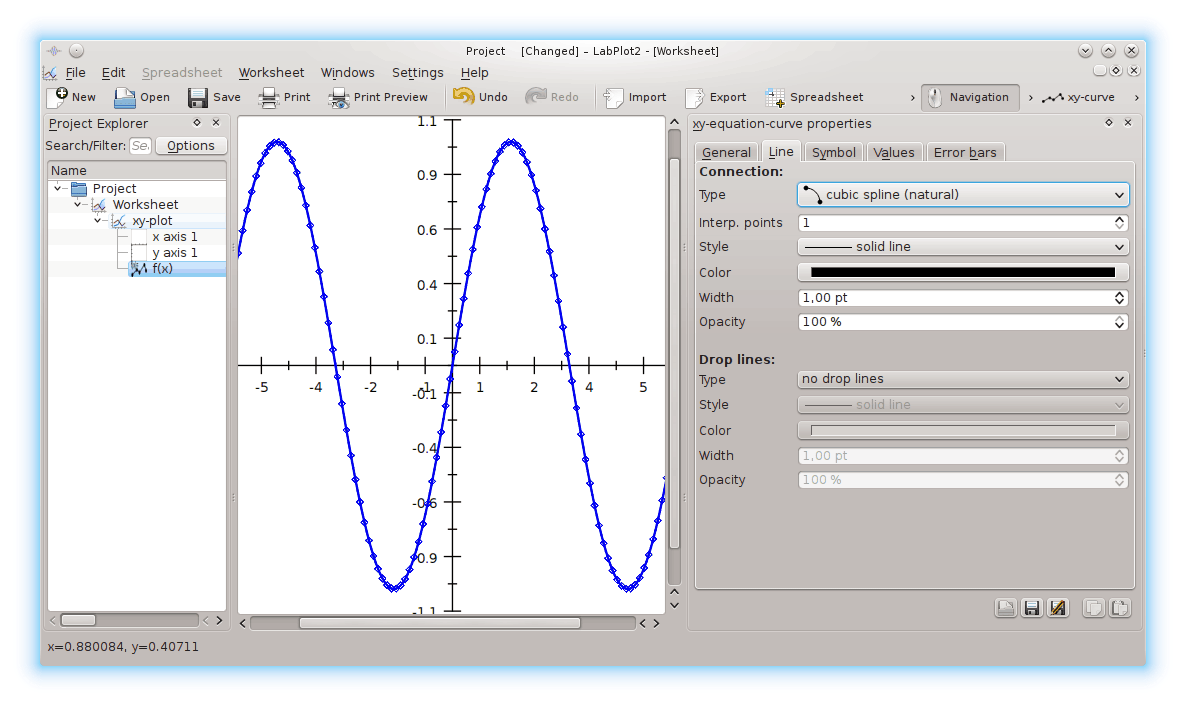
Switch to the Line tab on the xy-equation-curve properties pane and choose from the Type drop down box.
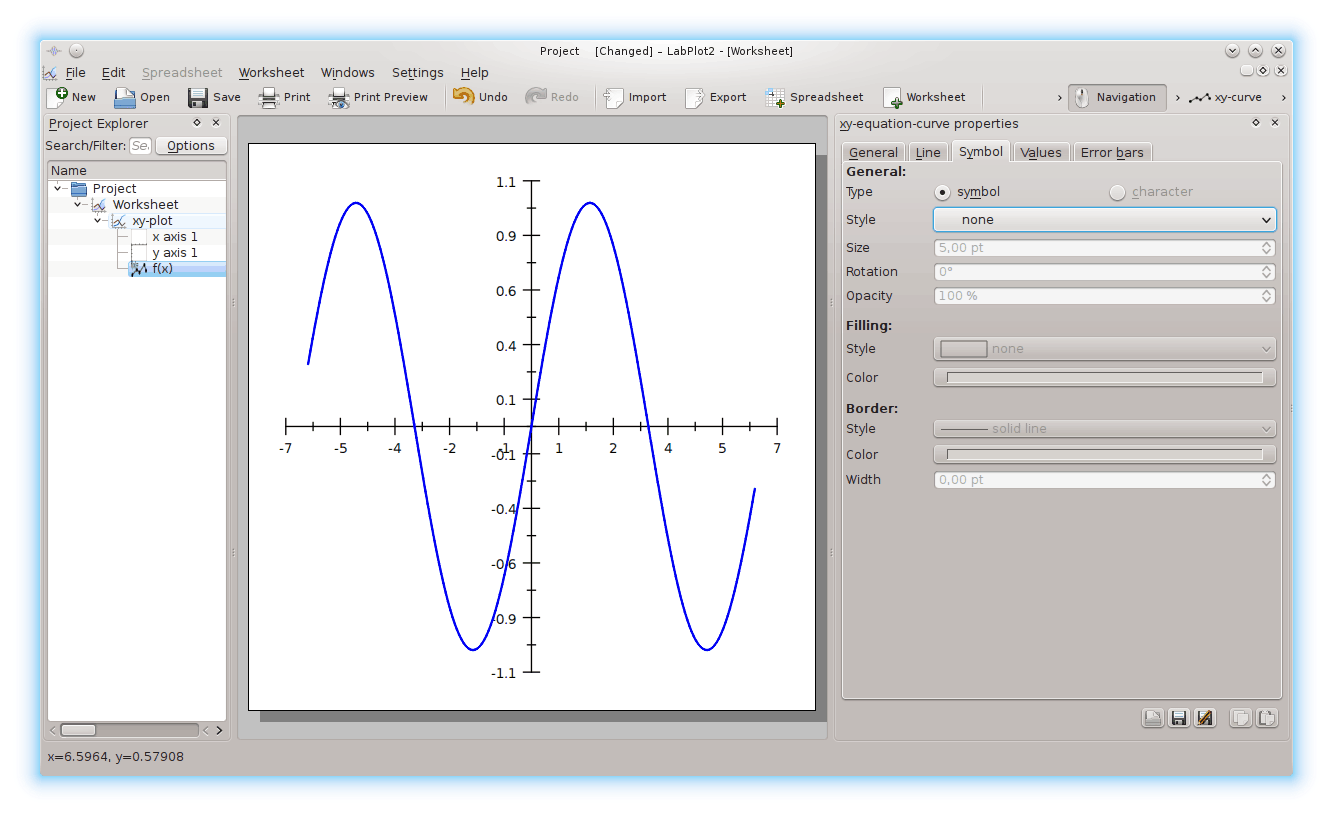
Switch to the Symbol tab on the xy-equation-curve properties pane and choose from the Style drop down list.
Click on the xy-plot item on the Project Explorer panel with the mouse button and choose → . Switch to the Title tab on the Cartesian plot legend properties pane and enter
Graph of sineinto the Text field.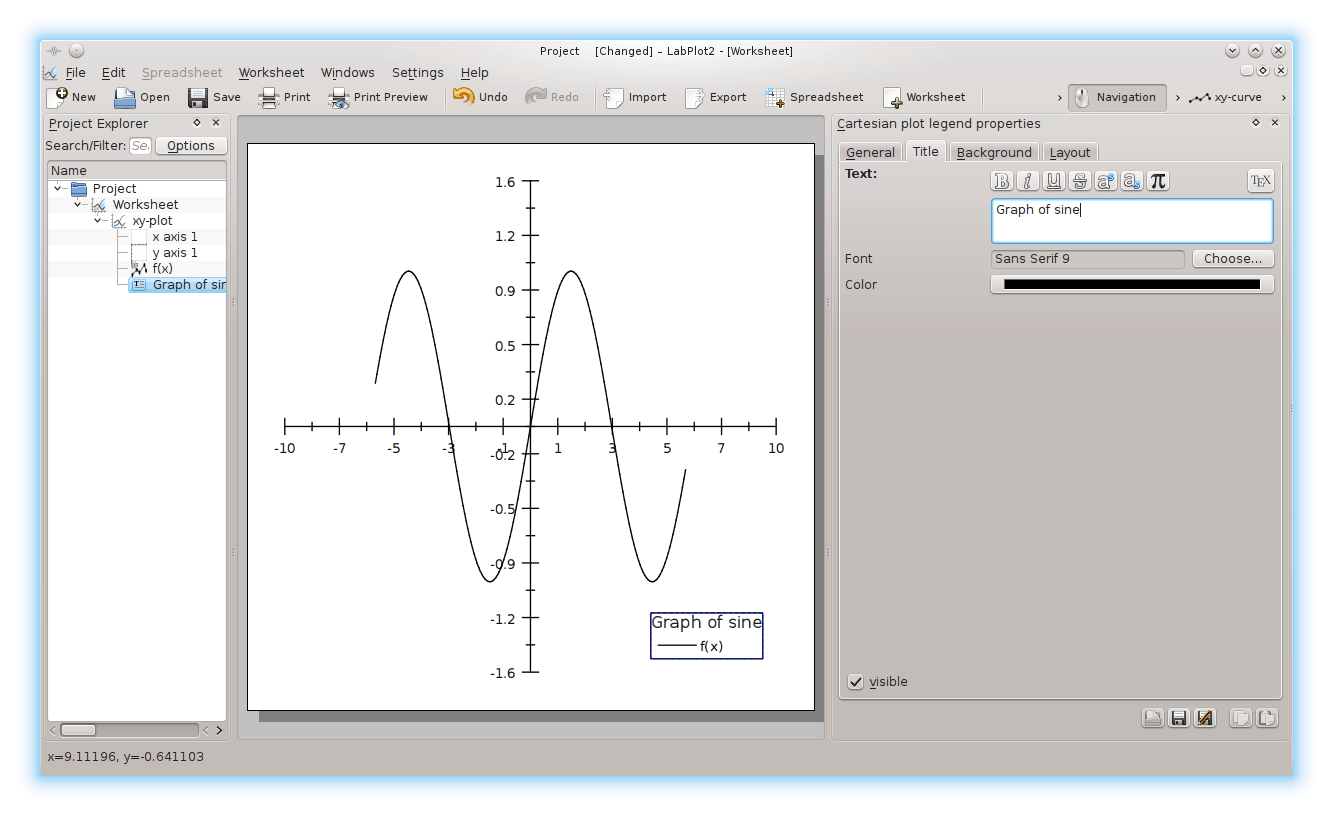
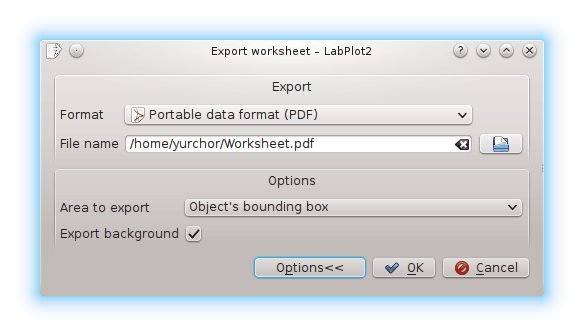
Choose → from the main menu. Select the place and the format to save the plot.