As you will see in the following screenshots, KSystemLog provides features to easily sort and filter log lines. We are now going to describe them in the next parts of this documentation.
When you start KSystemLog, by default it tries to open the most useful log, the System Log. If it does not display it and pops up a message box, you probably forgot to launch KSystemLog as an administrator user (commonly named root). The log files are usually available in the /var/log folder, which is often protected against normal users. In the settings dialog you can select another log to open at startup.
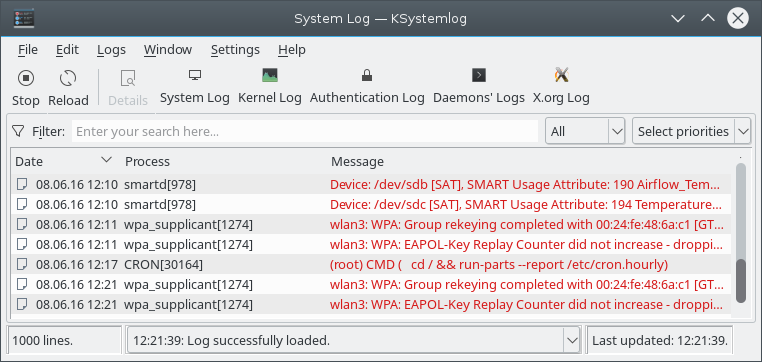
Every log lines are displayed in a list view, which can be sorted by clicking on the wanted column. Another click will sort it in the other order. If you want to sort the list as it was on the first loading, you can use the → menu item, or simply click on the first column of the list, generally named Date, to sort the list in the ascending order. Even if your log mode does not use time to describe each log lines, for example the X.org Log, the list will be correctly sorted, because KSystemLog keeps an internal order of the list.
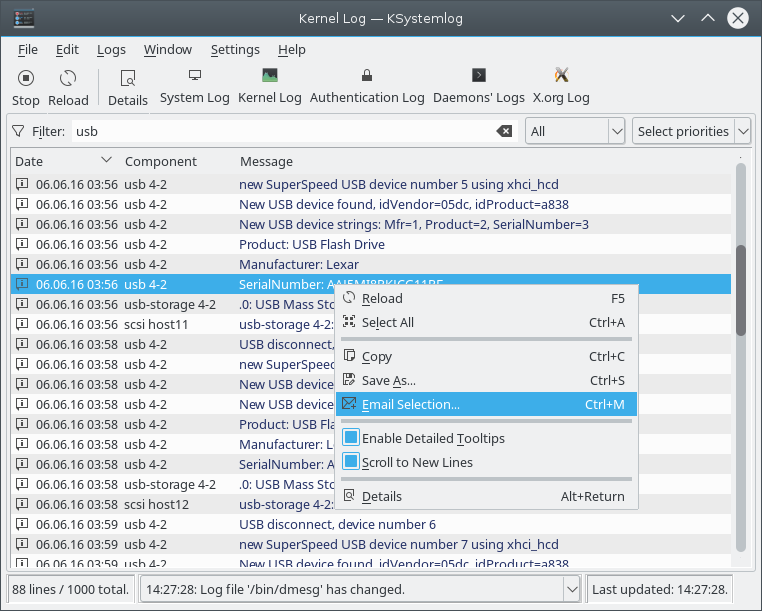
You can also use the filter bar to filter according to the selected criteria and the typed string. Simply type something in the filter, and the list will automatically be modified to only display lines which match your filter string. By default, the combo box next to the filter selects All, which means that a line will be displayed only if one of its columns contains the filter string.
You can select another field to filter only this column of the list. For example, in the System Log, by selecting the Process column, and writing a process name in the filter bar, KSystemLog will display every log lines sent by this process.
This option is activated by default and helps you see which lines have a higher level than the others. For example, Error level will be highlighted in a different color than the Notice one. This feature can be disabled in the configuration dialog.
If you are only interested in a specific process (for example in the System Log or the Cron Log), you can hide its PID in the Process column. This can be useful if you are trying to analyze the output of a specific command, like a Samba server. In this case, please use the Filter Bar.
KSystemLog provides an easy way to control the reading and the monitoring of log files. Indeed, sometimes you only need to analyze some existing log lines. In this case, you cannot tolerate the appearance of a new line. You can deactivate the monitoring of log files by clicking on the button. This stops the opened log files from being updated while still letting them get filled by other processes. Of course, you can reactivate the monitoring by clicking on , which will display the log lines added since the last pause.
Furthermore, to focus on the newly appeared log lines, you can toggle the option.