Kate's GDB plugin provides a simple frontend to the popular GNU Project Debugger.
Important
Previous experience with GDB is strongly recommended. For more information on using GDB, visit the GDB website.
You can enable the GDB plugin in the Plugins section of Kate's configuration.
For the plugin to work properly, you must have a source file (of any type supported by GDB) and an executable.
Tip
If you compile using gcc/g++ you might want to use
the -ggdb command line argument.
After these preparations are made, open the source file in Kate, enter the path to the executable in the Settings tab of the Debug View tool view, and select → from the menu to get started.
All of these options are available in Kate's menus, and many are available on the Debug toolbar as well.
- → →
Shows a tool view containing GDB output, the GDB command line used, and other settings.
- → →
Shows a list of all currently loaded variables and their values and a GDB backtrace.
- →
A submenu containing a list of targets (executables).
- →
Starts GDB with a target.
- →
Stops GDB.
- →
Restarts GDB.
- →
Set a breakpoint at the current cursor position.
- →
Execute the present statement (function call will be debugged).
- →
Execute the present statement (function call will not be debugged).
- →
Resumes execution until the program that is executing terminates.
- →
Move program counter (next execution).
- →
Runs the program until it reaches current cursor position.
- →
Ignores any breakpoints and executes program until it terminates (successfully or not).
- →
Prints the value of the variable that the cursor is currently pointing to.
- → →
Display the debugging toolbar.
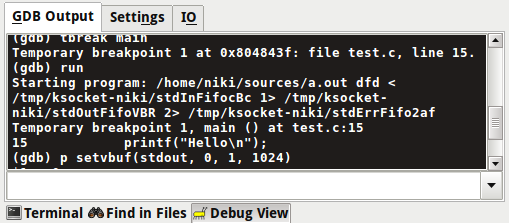
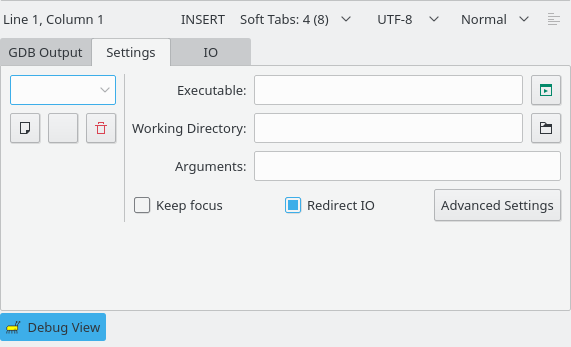
The Debug View tool view consists of several tabs:
- GDB Output
Contains output from GDB and a GDB command line.
- Settings
- Executable
Path to the target (executable) for debugging.
- Working Directory
The current working directory provided to the target.
- Arguments
Arguments passed to the program.
- Keep focus
Keeps focus on the GDB command line.
- Redirect IO
Opens a new IO tab in the Debug View where you can view output and provide input to the running program.
- IO
Contains an area that displays output from the running program and a command line where you may provide input to it.
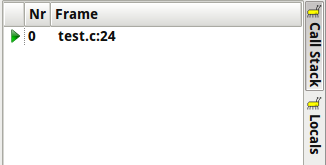
The Call Stack tool view contains a list of the formatted backtrace returned from GDB.
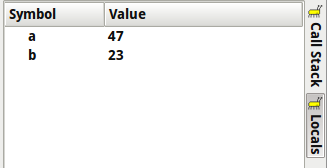
The Locals tool view contains a list of all currently loaded variables from the program and their corresponding values.


