The Analyze Module records and displays what happened in an imaging session. That is, it does not control any if your imaging, but rather reviews what occurred. Sessions are stored in an analyze folder, a sister folder to the main logging folder. The .analyze files written there can be loaded into the Analyze tab to be viewed. Analyze also can display data from the current imaging session.
When a new session begins (e.g. Ekos is disconnected at dawn, then reconnected at sunset) the system will start writing a new .analyze file. (This behavior can be controlled from the Analyze settings reached by clicking the options button on the lower right.)
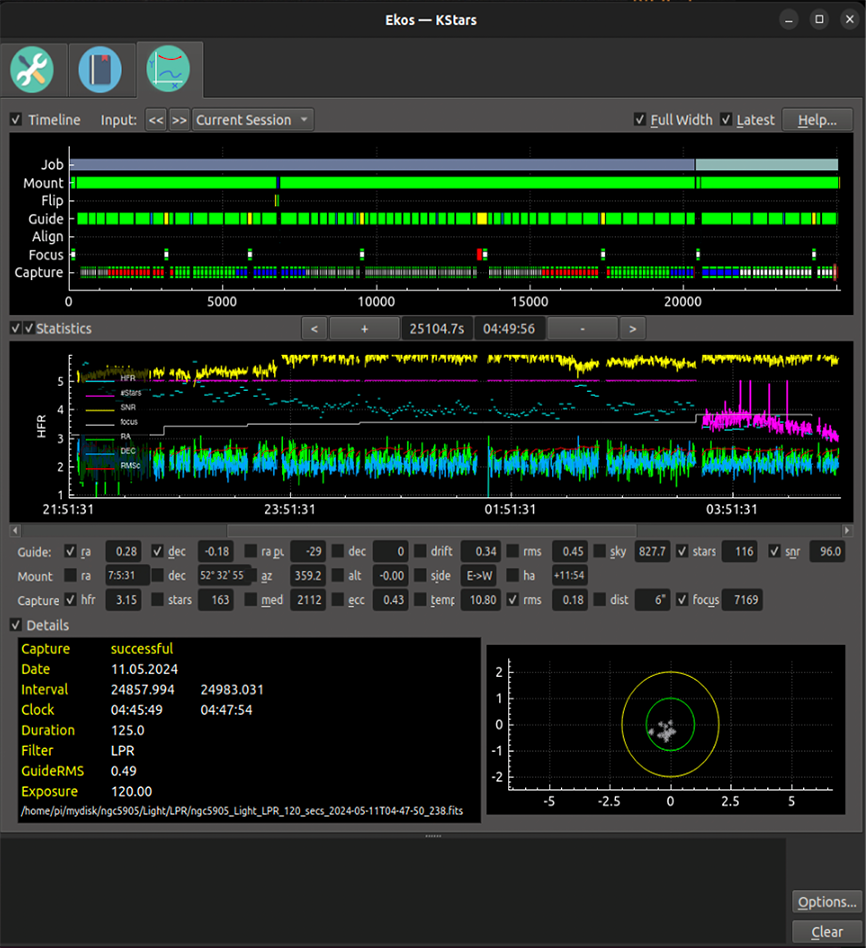
There are two main graphs, Timeline and Stats. They are coordinated—they always display the same time interval from the Ekos session, though the x-axis of the Timeline shows seconds elapsed from the start of the log, and Stats shows clock time. The x-axis can be zoomed in and out with the buttons, as well as with standard keyboard shortcuts (e.g. zoom-in == Ctrl++) The x-axis can be panned with the scroll bar as well as with the left and right arrow keys. You can view your current imaging session, or review old sessions by loading .analyze files using the Input dropdown. Using the << and >> buttons allows you to display the previous or following .analyze files chronologically. Checking Full Width displays all the data, and Latest displays the most recent data (you can control the width by zooming).
The three main displays can be hidden to make more room for the other displays. There are checkboxes to the left of the section titles (Timeline, Statistics, and Details) that enable and hide the displays.
Timeline shows the major Ekos processes, and when they were active. For instance, the Capture line shows when images were taken (wither green for RGB or color-coded by the filter) and when imaging was aborted (shown as red sections). Clicking on a capture section gives information about that image, and double clicking on one brings up the image taken then in a fitsviewer, if it is available.
Note
If you have moved your captured images, you can set an alternate directory in the analyze settings page you can reach from the Options button in the lower right. This alternate directory would be prepended to the base of part of the original file path and would be checked if the image file is not in its original location.
Clicking on a Focus segment shows focus session information and displays up the position vs HFR measurements from that session. Clicking on a Guider segment shows a drift plot from that session, (if it's guiding) and the session's RMS statistics. Other timelines show status information when clicked.
A variety of statistics can be displayed on the Statistics graph. There are too many for all to be shown in a readable way, so select among them with the checkboxes. A reasonable way to start might be to use rms, snr (using the internal guider with SEP Multistar), and hfr (if you have auto-compute HFR in the FITS options). Experiment with others.
The left axis shown is initially appropriate only for RA/DEC error, drift, RMS error, RA/DEC pulses, and HFR, plotted in arc-seconds and defaulting to a range of -2 to 5 arc-seconds. However, clicking on one of boxes below the Statistics graph (that shows a statistic's value) will set that statistic's range as the range shown on the left-axis. Double clicking on that box will bring up a menu allowing you to adjust the statistic's plotted y-range (e.g. setting it to auto, explicitly typing in the range, setting it back to its default value, and also changing the color of that statistic's plot).
The statistic shown on the left axis can also be scaled (awkwardly) using the mouse . It can be panned by dragging the mouse up or down over the left axis' numbers. Clicking anywhere inside the Statistics graph fills in the values of the displayed statistics. Checking the latest box causes the most recent values (from a live session) to be the statistics displayed. This graph is zoomed and panned horizontally in coordination with the timeline.