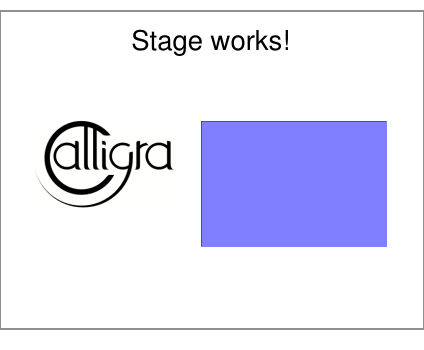
Let's insert another Calligra object under the picture, for example a chart.
Every Calligra supported object can be embedded in a Calligra Stage slide. Let's choose a chart from the Add Shape docker.
Select Chart and then outline with your mouse the area you want to put your chart in on the Calligra Stage slide.

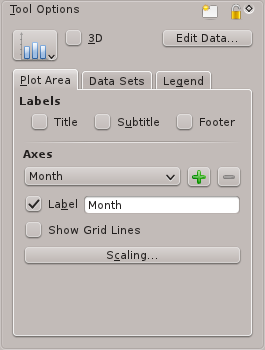
Once you release the mouse button, a template chart is added on the slide. Whenever you work in the chart, its Tool Options appear in the docker.

To move, resize or even delete the embedded chart switch to the tool and click anywhere within the chart area. It should now appear with a green border and with a small yellow square at each corner and in the middle of each edge.
If you move the cursor over any of the squares it should change to a double headed arrow. You can resize the chart by dragging one of these squares with the mouse button pressed. To delete the chart click on one of the squares and select .
To move the chart move the cursor into the chart. The cursor should then change to a cross, press the mouse button and you will be able to drag the chart to where you want it to be.
To restore the chart to its normal appearance simply click anywhere outside of the chart area.
To change the format of the chart itself click twice within the chart area. The chart Tools Options should appear in the docker. You can then use these tools to edit the chart properties like chart type, labels, axis and data.
Click anywhere with the mouse button outside the chart to go back to Calligra Stage slide.
A single click on the chart will allow you to drag it to change its location and also to drag the borders to make it bigger as with any other Calligra Stage object. Double click on the chart to get into KChart mode and modify any of the chart property.