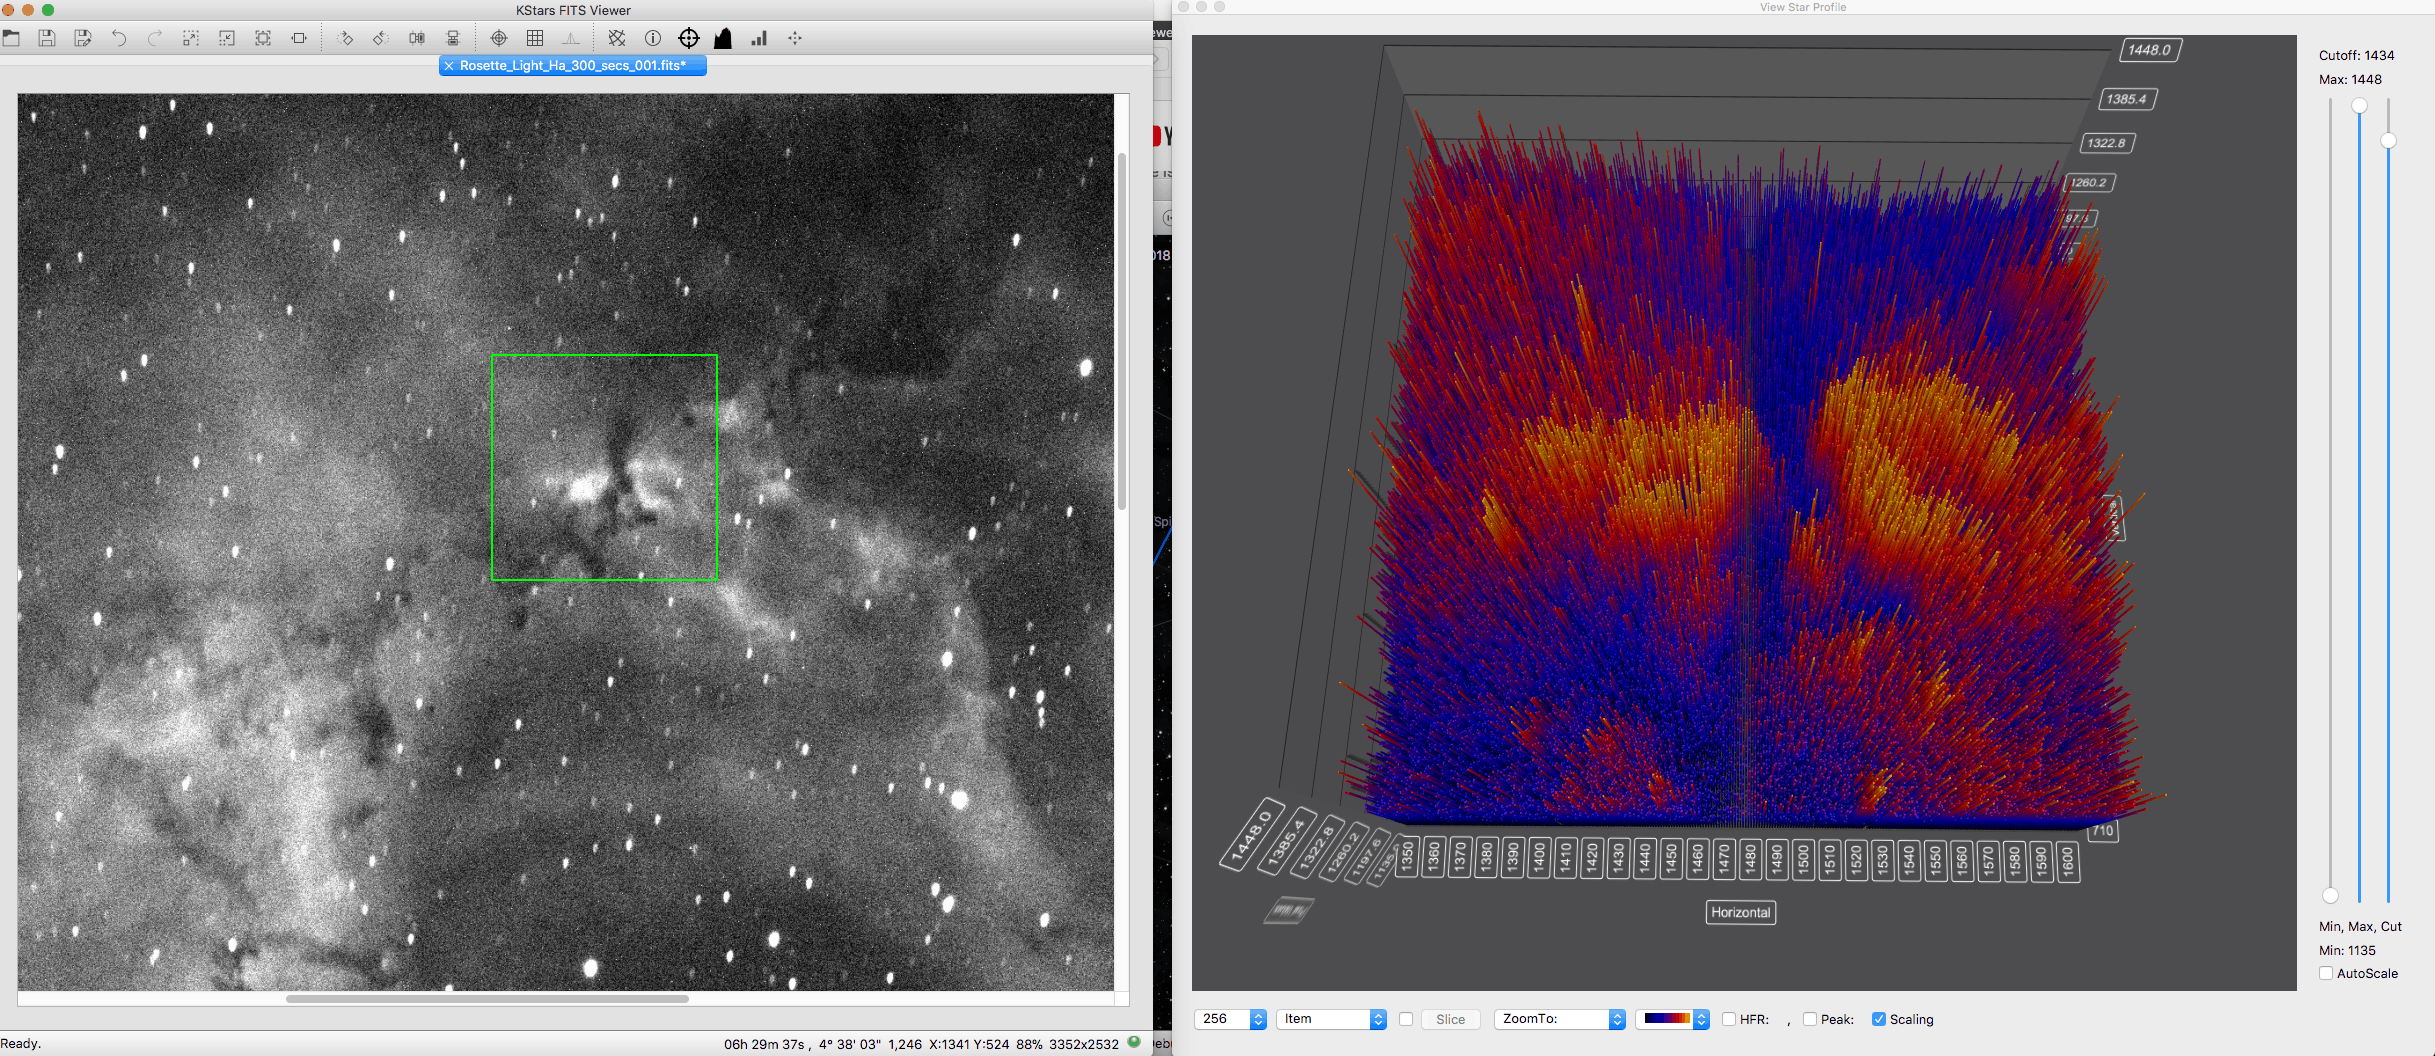
The 3D data visualization tool can plot 3D graphs of the selected region of the image. This is particularly useful for astrophotographers who want to visualize the profile of a star they are considering focusing or guiding on. For scientists, it enables them to examine a cross-section of the data to understand the relative brightness of different objects in the image. Additionally, it empowers imagers who want to visually see what is going on in their data collection in a new way.
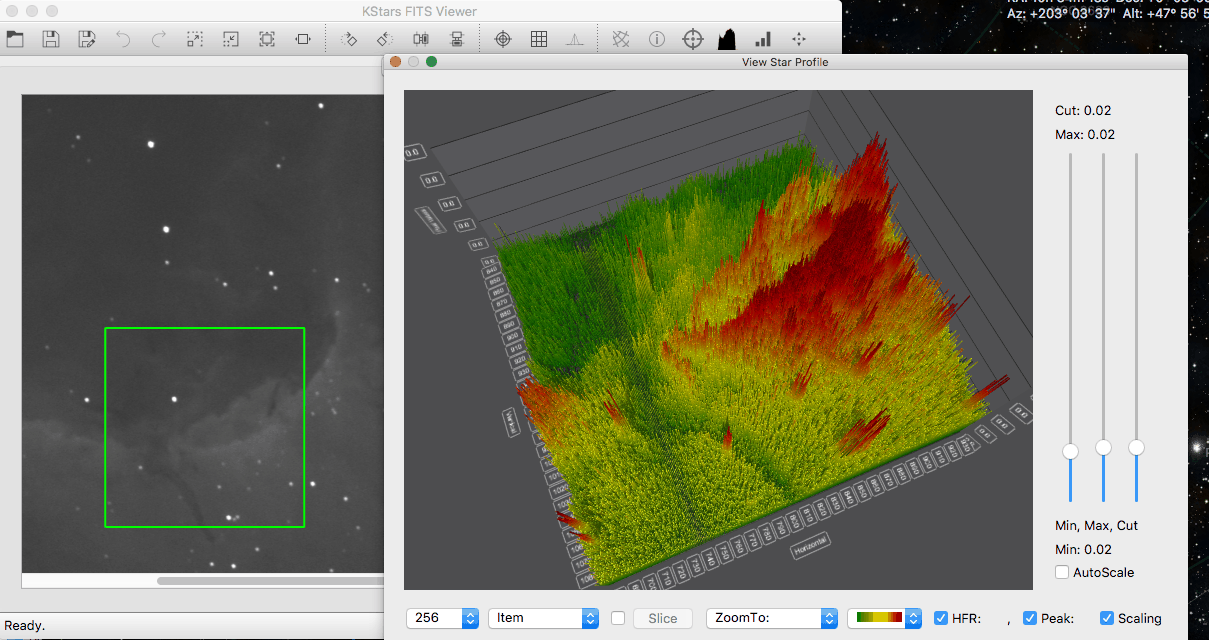
To use the new feature, the user needs to select the View Star Profile icon in one of the Ekos Module Views, or in the FITS Viewer. Then, the region selected in the green tracking box will show up in the 3D graph as shown above. The user will then have one of the following toolbars at the bottom.


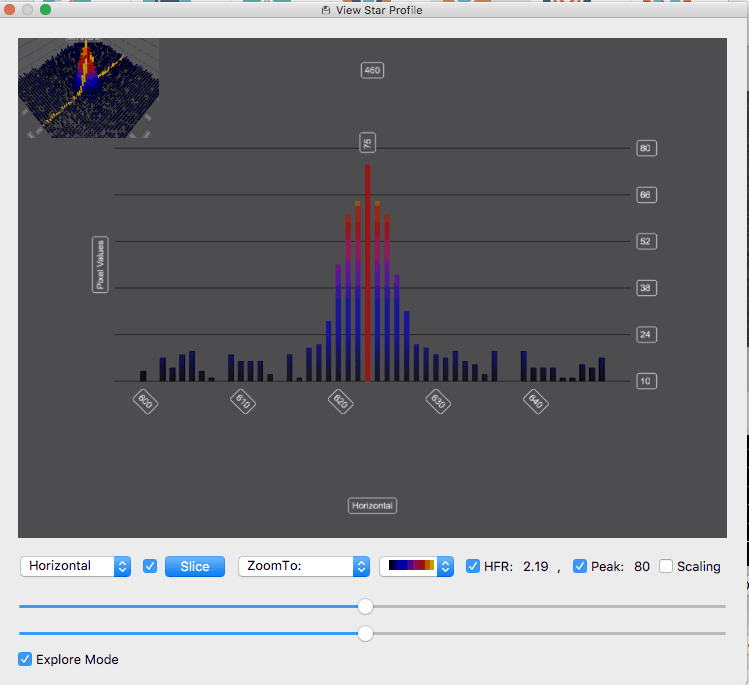
At the far left, the sample size combo box will let the user select the size of the image crop shown in the graph. This option is only available in the Summary Screen, the Align Module, and the FITS Viewer. The second combo box lets the user control whether they are selecting an individual item, or a row, or a column of pixels. The slice button will be enabled if the user selects or . It will put the graph in slice mode so that the user can see a cross-section view of the image. Third, is a checkbox that will open up two sliders that will let the user drag the slider to change the selection. This is extremely useful in the slide mode to change the selected point and to move the cross section around the graph. It is also useful in the normal view when in Explore Mode so that the user can zoom around the image examining the pixels.
Then the user has the Zoom To combo box, which the user can use to zoom the graph to different preset locations. Next is the combo box that lets the user select the color scheme of the graph. Then are the HFR and the Peak checkboxes, which will both turn on the HFR and Peak labels on each found star in the image, but will also display one of them at the bottom of the screen. And finally comes the Scaling checkbox, which enables the Scaling Side Panel. There are three sliders in that panel, one to control the minimum value displayed on the graph or “black point”, one to control the maximum value displayed in the graph or the “white point”, and a third that is disabled by default that lets the user control the cutoff value for data displayed on the graph.
This third slider is very useful to get really big peaks out of the way so you can study the finer details in the image. There is a checkbox at the top to enable/disable the cutoff slider. And finally at the bottom of the sliders is the button. This will auto scale the sliders as you sample different areas in the image. It will not only optimize the display of the data but will also affect the minimum and maximum points of the slider. If you disable auto scale, then as you sample different parts of the image, they will be displayed at the same scale. A particularly useful way to use this is to select an area of your image using auto scale, tweak the min, max, and cutoff sliders to your liking, and then turn off the auto scale feature to explore other areas of the graph.