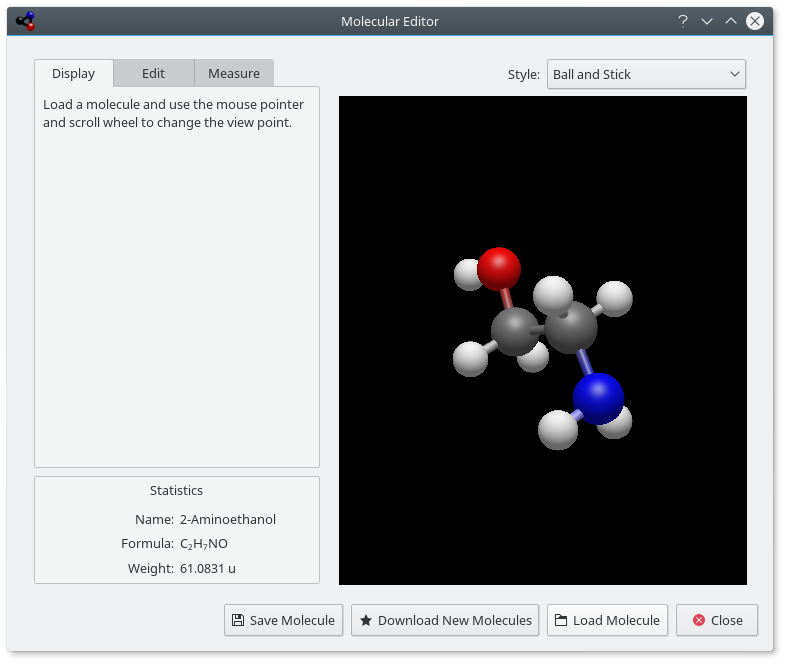
The Molecular Editor allows you to view and edit molecules using Avogadro 2 libraries.
Using the control panel on the left, you can change the view parameters, edit molecule, or measure molecules. There are three tabs on this panel: Display, Edit, and Measure. At the top of the window, there is a control to select the viewer Style: (can be , , , (AO means “Ambient Occlusion”), or ). The buttons along the bottom of the window can be used to , , , and the window. The downloaded files will be saved in your Documents folder from where you can load them into the editor.
Statistics pane shows name (if available), formula, and weight of the molecule.
The Display tab can be used to view a loaded molecule. By pressing the mouse pointer in the view, you can change the view point. Use mouse button to rotate molecule, mouse button to move it, and mouse button to zoom.
The Edit tab allows you to edit the molecule. You can add elements by choosing them in the Element drop-down list then clicking with the mouse button on the view panel on the right.
The Measure tab can be used to measure distances and angles in the molecule. To make the measurement use the instructions shown on the tab.
The Isotope Table shows you the isotopes of the elements.
There are different kinds of isotopes, some are stable, some are not. The unstable isotopes can decay as alpha-rays are two different beta-rays. These differences are encoded by using different colors.
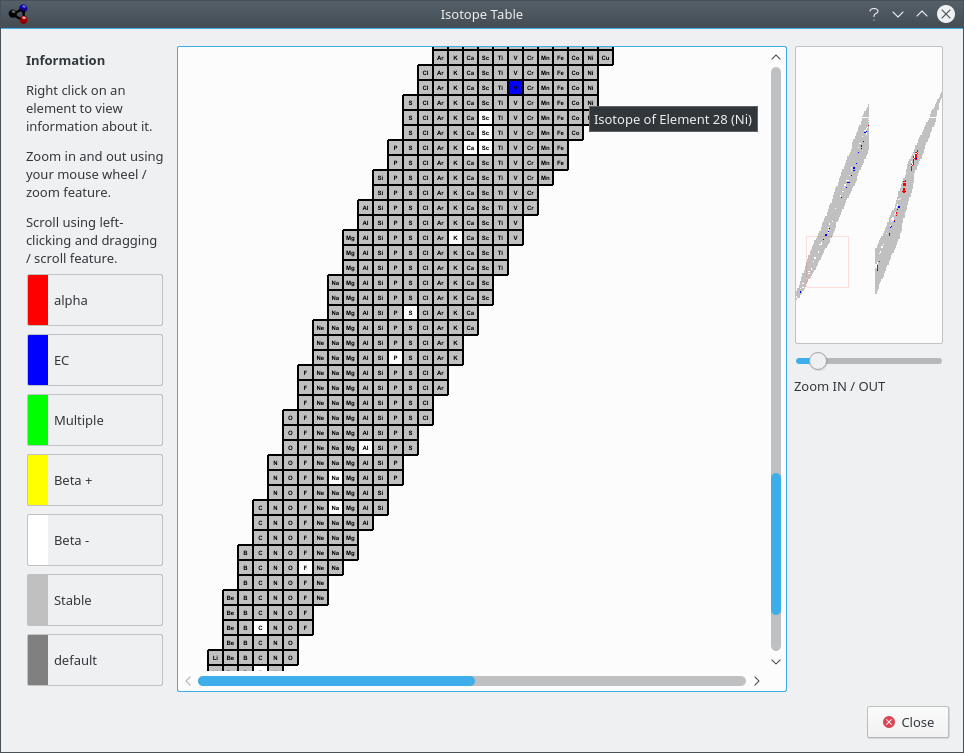
Kalzium can display the isotopes of a range of elements
The Plot Data dialog allows you to plot some information about elements. The X-axis represents a range of elements (from one number to a higher number). You set this range using the First element: and Last element: fields on the dialog. Click the  button between the axis panes to swap X and Y axes.
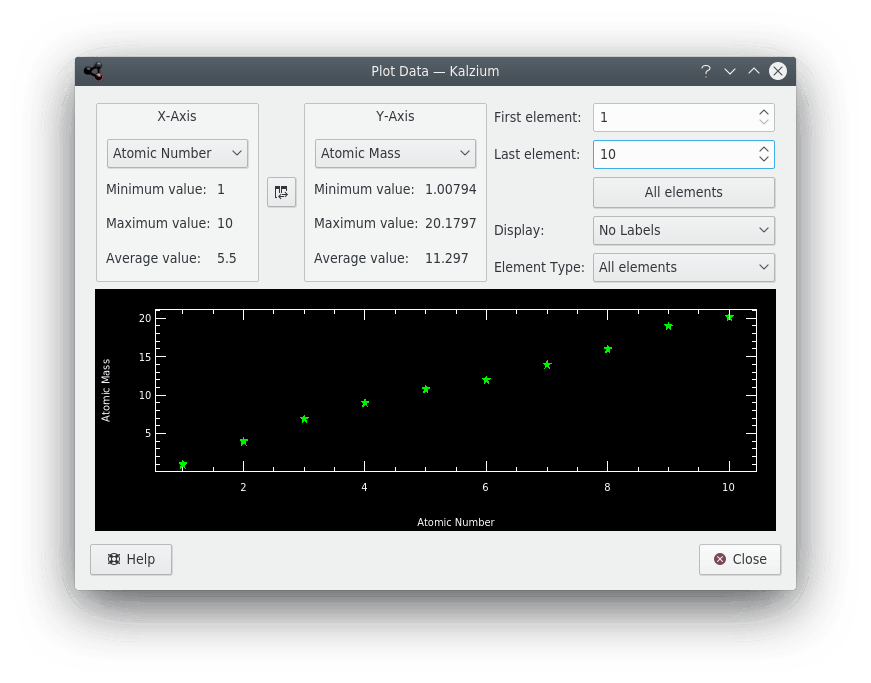
Kalzium can plot some data about a range of elements.
The is the Kalzium calculator. This calculator contains a variety of calculators for different tasks performing different calculations.
You can find the following calculators in Kalzium:
- Molecular mass calculator
This calculator helps you calculate the molecular masses of different molecules.
You can specify short form of the molecule names add more such aliases.
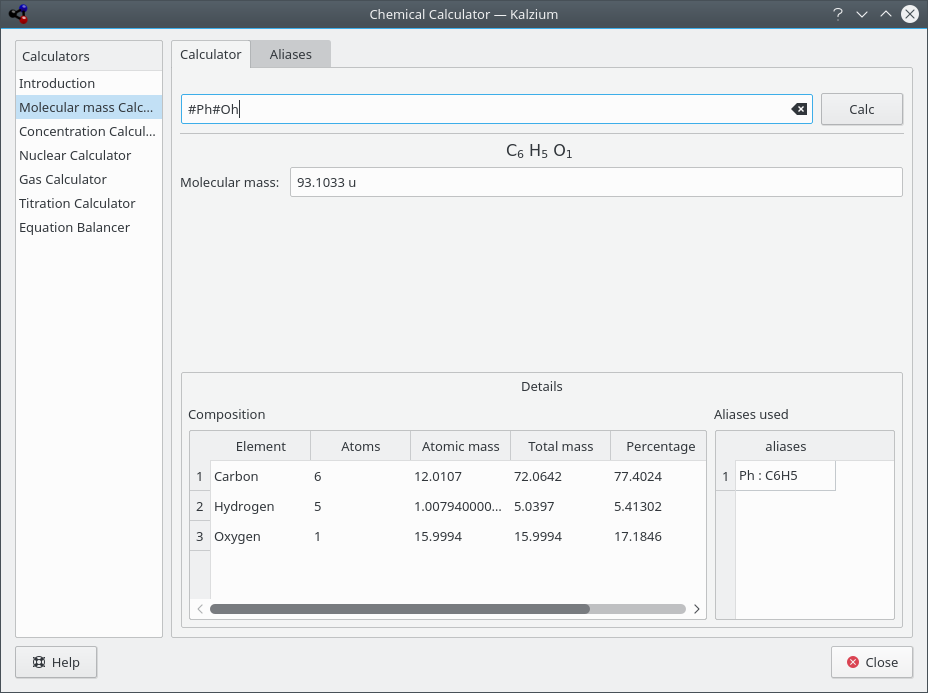
Kalzium calculates molecular mass of phenol.
- Concentrations calculator
You can calculate quantities which include:
Amount of solute
Density of solvent
Density of solute
There are a wide range of units to choose from and different methods to specify quantities.
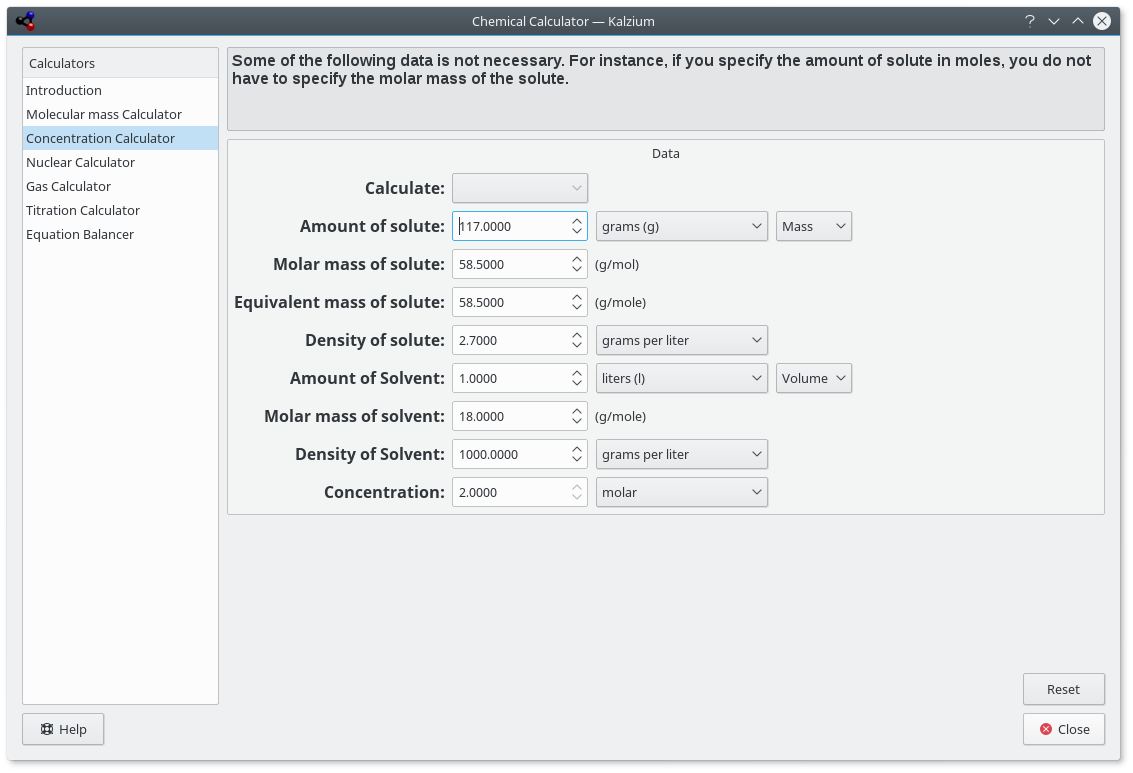
Kalzium calculates solution parameters.
- Nuclear calculator
This calculator makes use of the nuclear data available in Kalzium to predict the expected masses of a material after time.
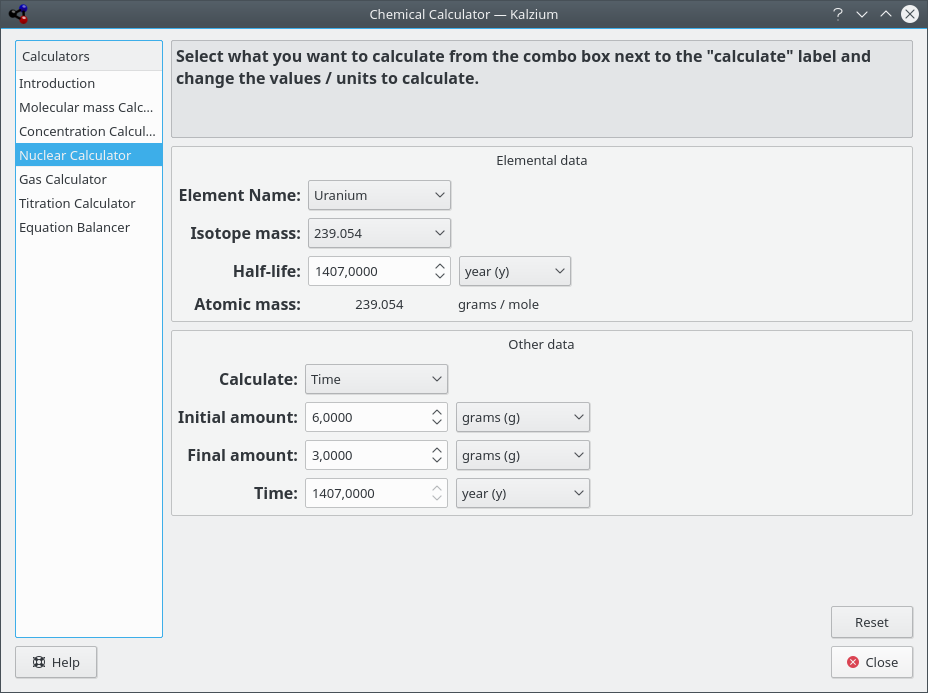
Kalzium calculates parameters of uranium decay.
- Gas calculator
This calculator can calculate the values of Temperature, pressure, volume, amount of gas etc. for various ideal as well as non-ideal gases.
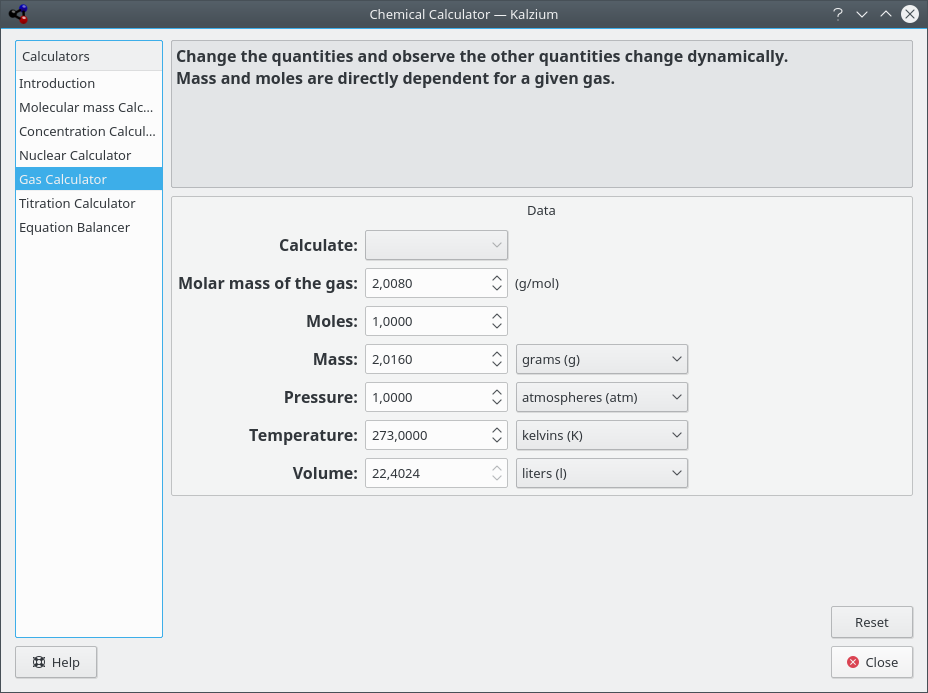
Kalzium calculates gas parameters.
- Titration calculator
This calculator tries to find out the equivalence point of a pH-meter followed titration best fitting it with an hyperbolic tangent. You can also let it solve an equilibrium system of equations and see how the concentration of a species changes in function of another one.
There are two tabs on the calculator page, namely:
- Experimental values
You can use this calculator to draw the plot of your experimental data obtained during a titration and find out the volume of equivalence. It's strongly recommended to insert a even number of points, because of the best fit algorithm, sorted by volume (the X axis: value).
- Theoretical Equations
Here you can fill the table with the equations you have previously obtained for the chemical equilibrium.
For example, if you have this reaction A + B -> C + D then you will have the equation K=(C*D)/(A*B) so you must write
Kin the Parameter column and(C*D)/(A*B)in the Value column. If you want to assign a known value to a parameter you can simply write the numeric value in the Value field.For example, you can use the system
A=(C*D)/(B*K)K=10^-3C=OHOH=(10^-14)/HH=10^-4B=6*(10^-2)Then you have to write
Das X axis: andAas Y axis:: so you will find out how the concentration of A changes as a function of D concentration.Note
Please don't use parenthesis for exponents:
10^-3is correct, while10^(-3)is wrong.
The results can be visualized by pressing button. The plot shows in red the curve that comes from theoretical equations, in blue the experimental points, and in green the approximated curve for experimental points. You can save the plot as SVG image.
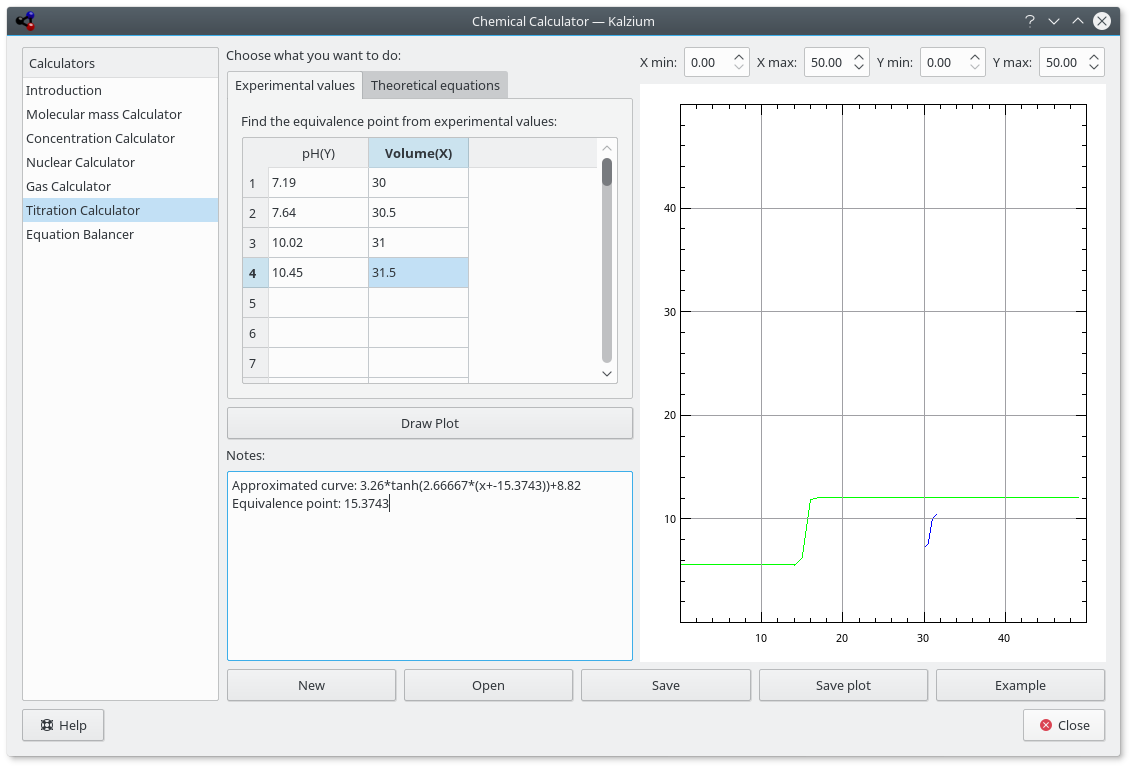
Predefined example of titration results.
- Equation Balancer
The Equation Balancer enables the user to solve chemical equations. This is an example:
aH2O + bCO2 -> cH2CO3
The computed equation will be displayed on the top of the window. As you can see in the first example you can also define the value of one or more coefficients. The other coefficients will be adjusted. Furthermore, it is possible to use brackets around elements or electronic charges as shown in the last two examples.
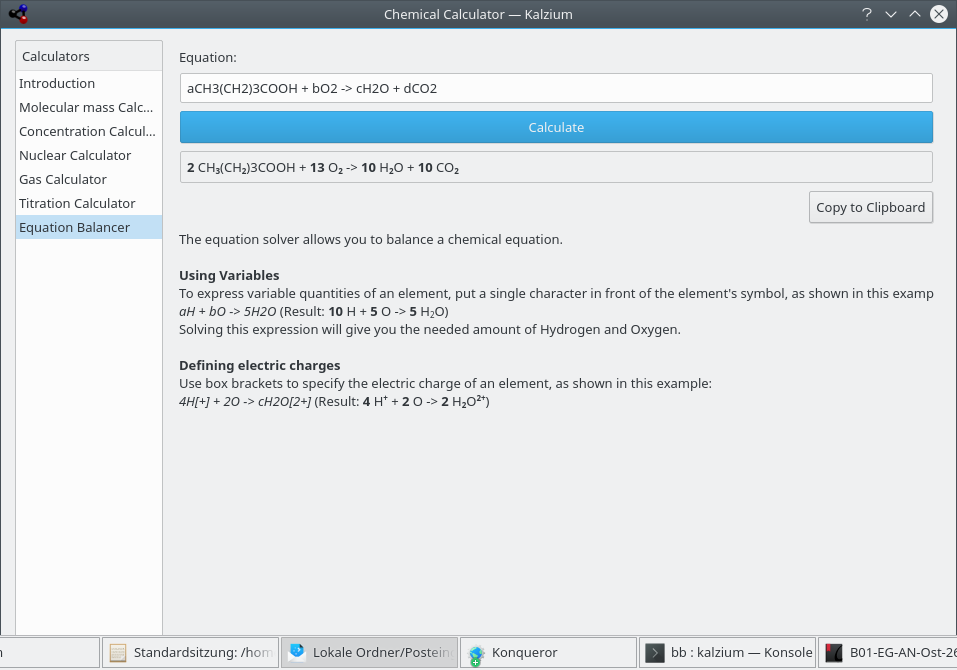
Kalzium calculates equation balance.
The R/S Phrases, also known as Risk and Safety Statements, R/S statements, R/S numbers, and R/S sentences, is a system of hazard codes and phrases for labeling dangerous chemicals and compounds. The R/S phrase of a compound consists of a risk part (R) and a safety part (S), each followed by a combination of numbers. Each number corresponds to a phrase. The phrase corresponding to the letter/number combination has the same meaning in different languages.
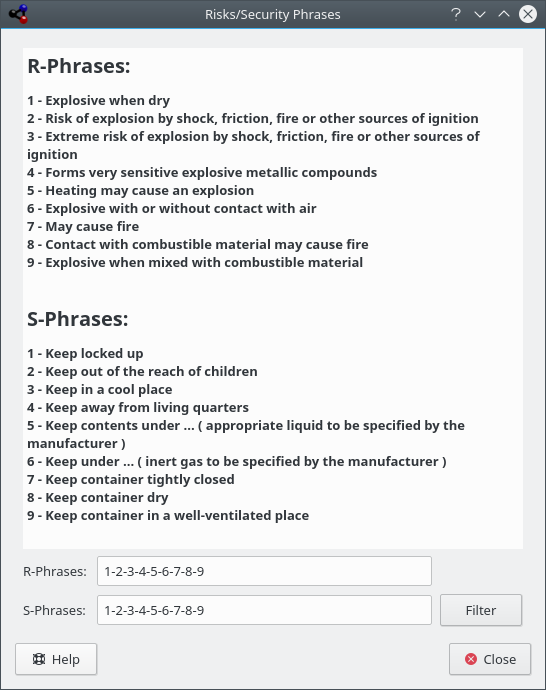
Kalzium can display Risk/Security Phrases
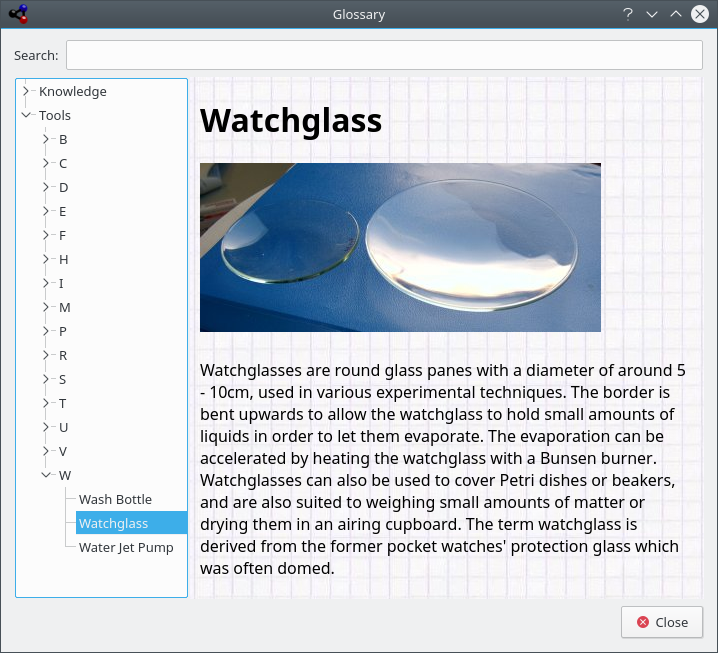
The Glossary gives you definitions of the most used tools in chemistry as well as some knowledge data. On the left side of the windows you can see the tree of items. On top, there are chemical terms, below that there is a second tree of laboratory-tools.
On the top of the widget you can see a searchbar. If you type in the bar the trees will be adjusted immediately. The small button in the right end of the searchbar will clear it.
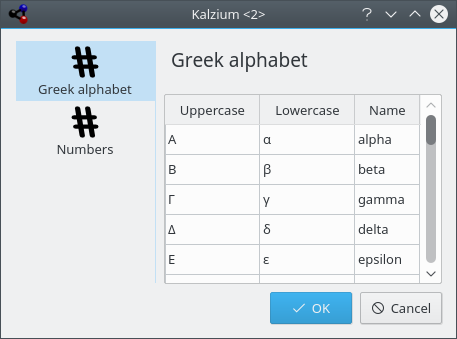
The Tables shows you the tables for Greek alphabet which is used to denote some chemical and physical entities, and for Latin prefixes and Roman numbers which correspond to common Arabic numbers.
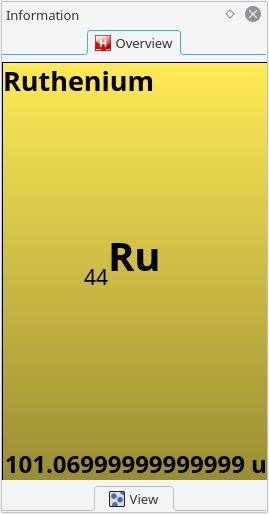
The Overview tab is the first one and it shows you an overview of the element the mouse is over.
The View tab is the second in the navigation panel.
You are first presented with the following icons and text:
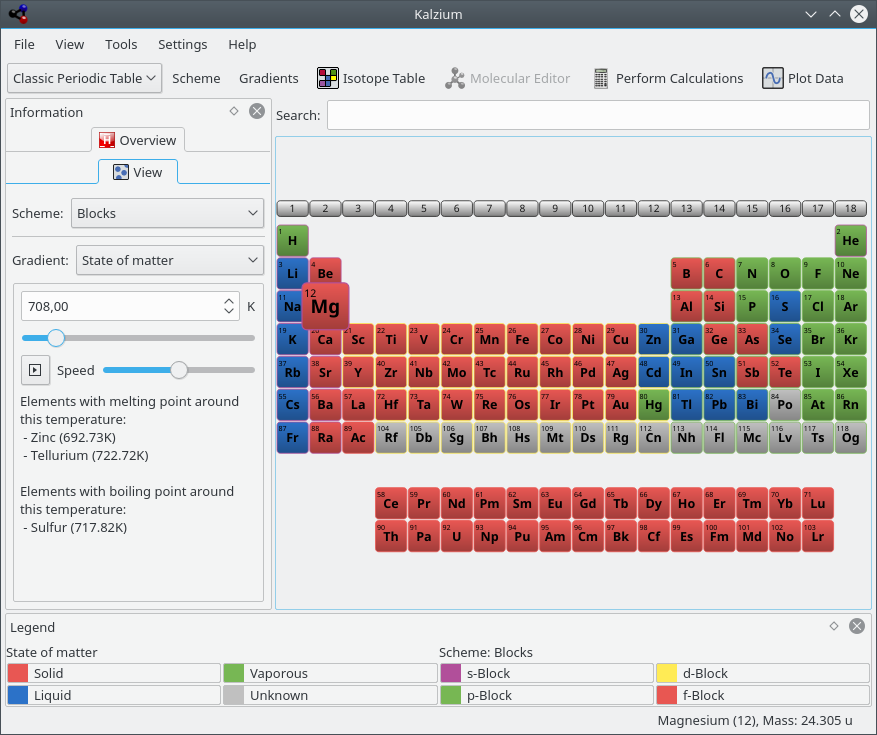
Kalzium can show you which elements are solid/liquid/vaporous at a given temperature.
The View tab can be used to filter PSE. For example, this feature allows you to explore the elements of the set time period. This is great for getting a feel for how the PSE evolved over time, as more and more elements were discovered. Choose from Gradient: list. If you move the slider you will notice that color of some elements disappear if you move it to the left and reappear if you move it to the right. Furthermore the number will change constantly.
The number represents the date you are looking at. If you move the slider to e.g. 1856 you will only see the elements which where known in the year 1856.
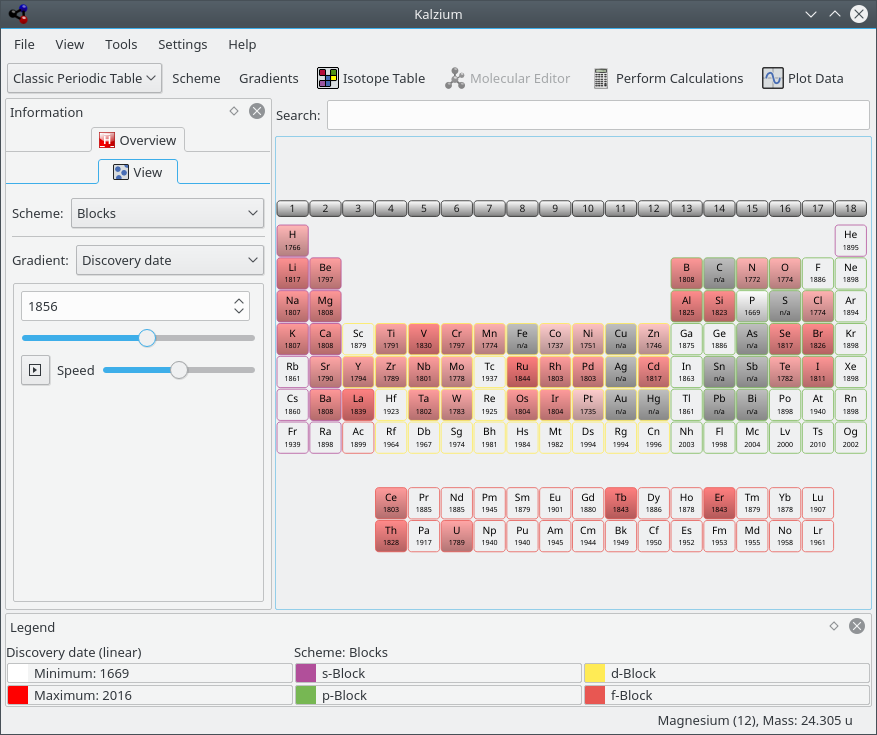
The PSE back in time (elements known in 1856)