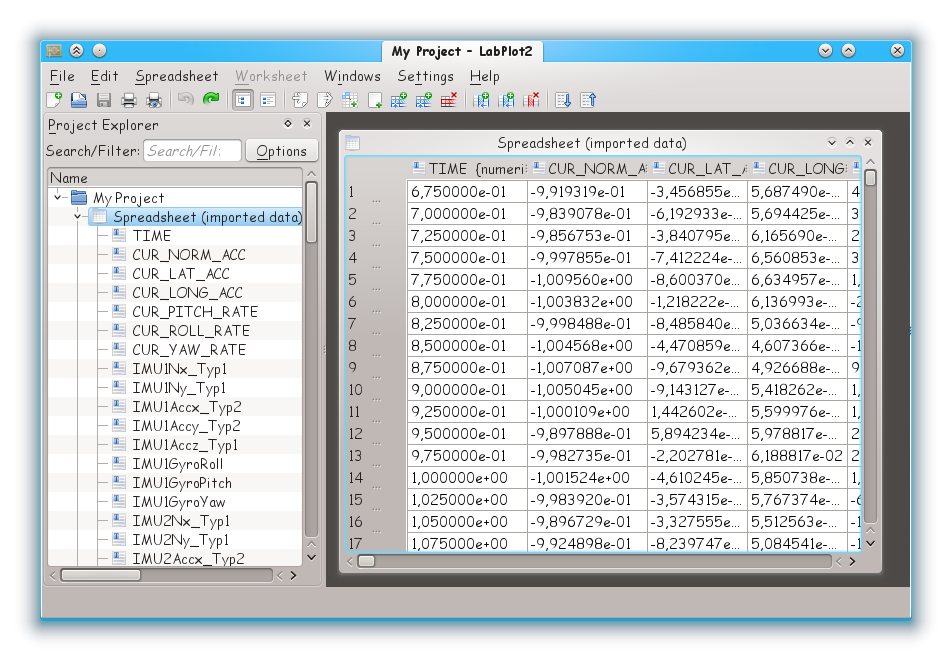
The spreadsheet is the main part of LabPlot when working with data and consists of columns. Column is the basic data set in LabPlot used for plotting and data analysis. Every column of the spreadsheet is specified by its name and the type - numeric, text, month names, day names and date and time. Also, for each type different representation formats can be assigned like decimal or scientific format for numeric columns etc.
You can mask selected data points in the spreadsheet ( → from the spreadsheet cell context menu). Masked data is not plotted and is also excluded from data analysis functions like fitting etc. Alternatively, you can mask or drop values in a column ( or from the column context menu) by specifying a range. When specifying which values to mask or to drop, several operators (“equal to”, “greater than”, “lesser than”, etc.) are available. These operations can help to hide or to remove some outliers in the data set prior to, e.g., performing a fit to this data set.
Any spreadsheet function can be reached via the context menu ( mouse button click). You can cut, copy and paste between spreadsheets, generate, normalize and sort data and finally make plots out of your data.
New data can be produced either by entering it manually in the spreadsheet or by generating the data according to a certain prescription. LabPlot provides 5 different methods to generate data, accessible via the context menu of the column:
Row Numbers - values in the column are set according to its row number, this provide an easy way to quickly create an index.
Const Values - values in the column are set to a constant value provided by the user.
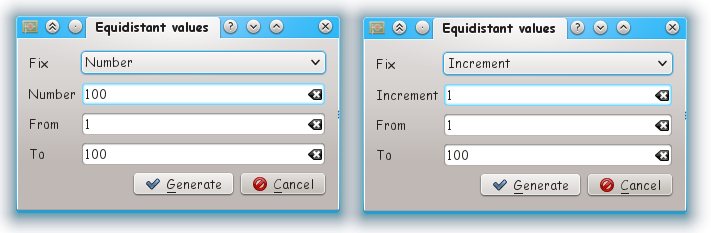
Equidistant values (for numeric columns only) - given the minimal and the maximal values, the equidistant values can be either generated by fixing the total number of values in that range or by fixing the increment (distance).
Random values (for numeric columns only) - values are randomly generated according to the selected distribution. To generate uniformly distributed random numbers, select "Flat" distribution.
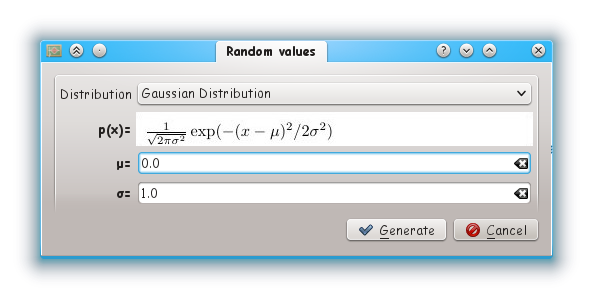
In the simplest cases a non-uniform distribution is calculated analytically from the uniform distribution of a random number generator by applying an appropriate transformation. More complicated distributions are created by the acceptance-rejection method, which compares the desired distribution against a distribution which is similar and known analytically.
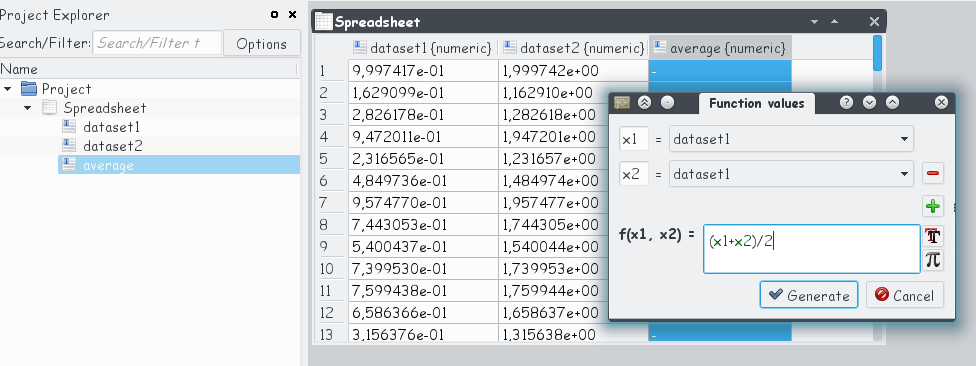
Function values (for numeric columns only) - values are generated according to a mathematical function provided by the user, a column (data set) containing the function arguments has to be provided. It is possible to define a multivariant function and to provide a data set (a column in a spreadsheet) for each of the variables. The corresponding dialog supports the creation of arbitrary number of variables.
Already existing data can be imported into a spreadsheet from external files via the "Import Data" dialog. Imported data will be stored in the project file. Changes on data, performed either in the spreadsheet or in the external file after the import, are not synchronized anymore.
The data in the spreadsheet can be exported to an external file (see Export Dialog).