Datapicker is a tool that allows you to easily extract data from image files. The process of extraction consists mainly out of the following steps:
Import an image containing plots and curves where you want to read the data points from.
Select the plot type (cartesian, polar, etc.).
Select tree reference points and provide values for them. With the help of these points the logical coordinate system is determined.
Create a new datapicker curve and set the type of the error bars.
Switch to the mouse mode "Set Curve Points" and start selecting points on the imported image - the coordinates for the selected points are determined and added to the spreadsheet "Data".
It is possible to add more then one datapicker curve. This is useful in case the imported image contains several curves that need to be digitized. The datapicker curve that is currently being selected in the Project Explorer is the "active" one - points clicked on the datapicker image will be calculated and added to its data spreadsheet.
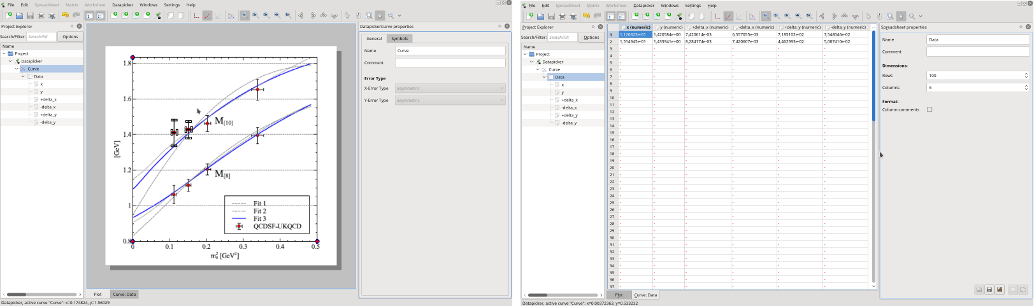
Calculated values are stored in different columns in data spreadsheets in the datapicker. These columns behave exactly the same like other columns in usual spreadsheets and can be directly used as source columns for curves in your own plots.
Datapicker supports the process of the data extraction with several helpers. To place the points more precisely, a magnification glass with different magnification levels is available. Also, the last selected point can be shifted with the help of the navigation keys. Furthermore, when reading data points having error bars, datapicker automatically creates bars indicating the end points of the error bars. Those bars can be pulled with the mouse until the required length (the distance to the data point) is reached.
The procedure for the extraction of data from an imported plot as described above is feasible when dealing with a limited number of points. In case the curves in the imported image are given as solid lines, the datapicker tool in LabPlot allows to read them (semi-)automatically. For this, after a new datapicker curve was added as described above, switch to the mouse mode "Select Curve Segments". The curves on the plot are recognized and highlighted. By clicking on a highlighted curve (or one of its segments), points along this curve are created. The length of a segment and the density of created points (separation between two points) are adjustable parameters. On the screenshots below, after switching to the segment mode all black lines were highlighted (green colour). In this specific case, the curve was recognized as a single segment and a single mouse-click on this segment is sufficient to digitize this curve and to automatically place points along the curve.
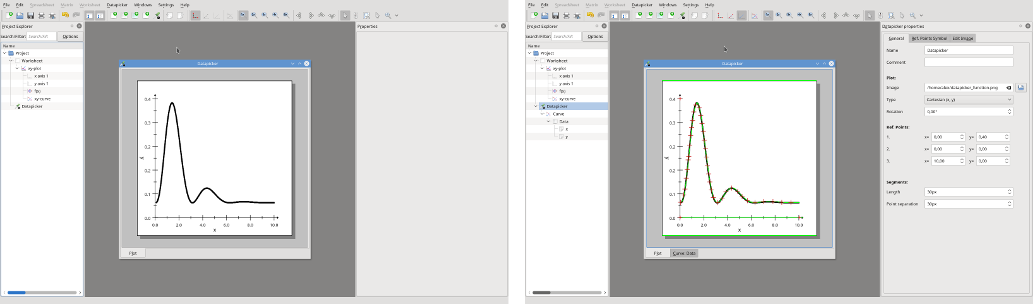
In many cases the plot is not as simple as above (single black curve on white background) and contains grid lines, many curves of different colour and thinness and a non-white background. In such a case the automatic detection fails (too many or no objects are highlighted). To help the datapicker to determine the curve(s) correctly, the user has to limit the allowed ranges in the HSV (or HSI) colour spaces. To subtract the non-white background it is possible to limit the range for the foreground colour, too. Internally, each pixel of the image is converted to black and white where only the points fitting into the user-defined ranges for hue, saturation, value, intensity and foreground are set to black.
On the screenshots below, the blue curves in the original image were projected onto by having appropriately reduced the allowed ranges in the colour space (note the peak for blue in the histogram for the hue). The transformed black and white image contains only the curves the user is interested in and it is now an easy task for the datapicker to determine the curves and to place points on them.
Similar to Worksheet, the currently visible area in the datapicker can be exported. The supported image formats as described in the section Export Dialog.