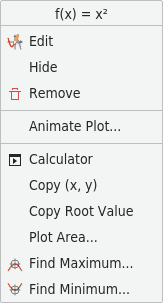
When right-clicking on a plot function or a single-point parametric plot function a popup menu will appear. In the menu there are five items available:
Selects the function in the Functions sidebar for editing.
Hides the selected graph. Other plots of the graph's function will still be shown.
Removes the function. All its graphs will disappear.
Displays the Parameter Animator dialog.
Opens the Calculator dialog.
Depending on the plot type, there will also be up to five tools available:
Copies the current value on the plot to the system clipboard. This tool can be useful for creating tables of function values outside of KmPlot.
Copies the root
xvalue to the system clipboard. Only up to the first five digits after the decimal point can be copied. Use some computer algebra system to determine this root with arbitrary precision. This tool is only available when the current tracking position is close to a root.Select the minimum and maximum horizontal values for the graph in the new dialog that appears. Calculates the integral and draws the area between the graph and the horizontal axis in the selected range in the color of the graph.
Find the minimum value of the graph in a specified range. The selected graph will be highlighted in the dialog that appears. Enter the lower and upper boundaries of the region in which you want to search for a minimum.
Note: You can also tell the plot to visually show the extreme points in the Plot Appearance dialog, accessible in the Functions sidebar by clicking on .
This is the same as above, but finds the maximum value instead of the minimum value.