You can insert a chart into a sheet to give a graphical view of your data.
First enable Add Shape docker using the → menu item.
Then select the area of cells containing the data and choose Chart in the Add Shape. Drag the cursor across the sheet while holding the mouse button down to define the area where you want the chart to appear, there is no need to be too accurate at this stage as the chart size can easily be changed at any time. When you release the mouse button a Chart Options dialog box will appear.
The data area is already prefilled with the selected cell range. Select the first row and column as labels, check Data set in rows and click the button. The Dialog will vanish and you will see the chart embedded into the worksheet.
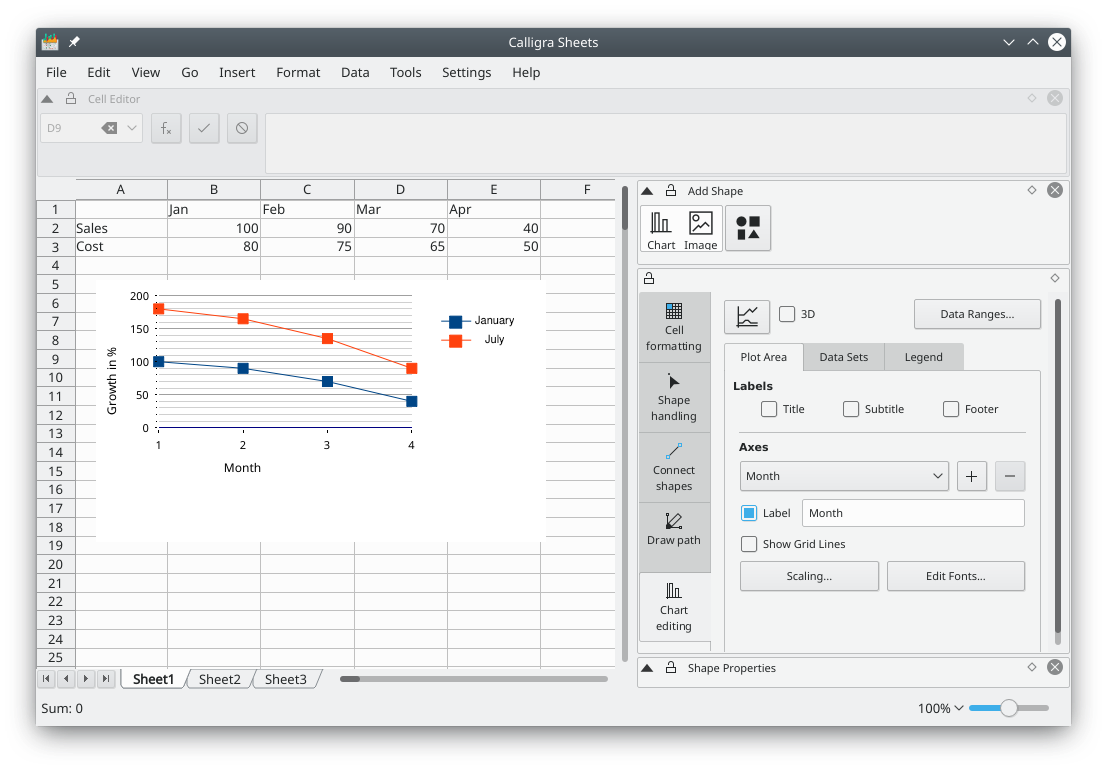
Now select from the Tools docker and edit the chart properties like chart type, labels and axis in the Chart editing.
To move, resize or even delete the embedded chart switch to the tool and click anywhere within the chart area. It should now appear with a green border and with a small yellow square at each corner and in the middle of each edge.
If you move the cursor over any of the squares it should change to a double headed arrow. You can resize the chart by dragging one of these squares with the mouse button pressed. To delete the chart click on one of the squares and select .
To move the chart move the cursor into the chart. The cursor should then change to a cross, press the mouse button and you will be able to drag the chart to where you want it to be.
To restore the chart to its normal appearance simply click anywhere outside of the chart area.
To change the format of the chart itself click twice within the chart area. The chart Chart editing should appear in the docker. You can then use these tools to change the chart.