Khipu is an advanced mathematical function plotter application.
It is part of the KDE Education Project and a replacement of an earlier function plotting application KmPlot.
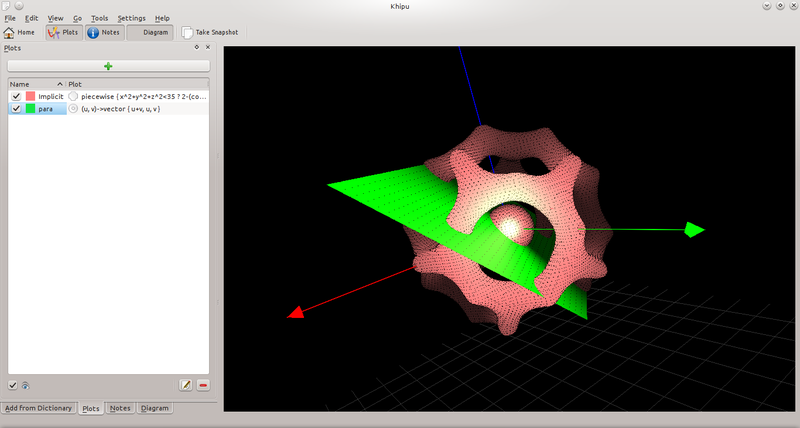
Khipu space-3D
Khipu uses an abstraction of space in order to save the plots requested by user. A space will have its name and corresponding description from which it can be identified by the user later in time. Khipu has two types of spaces (2D and 3D). User can save the plot in either of the spaces depending on his/her wish. Every space will contain multiple plots of different colors, intervals and types.
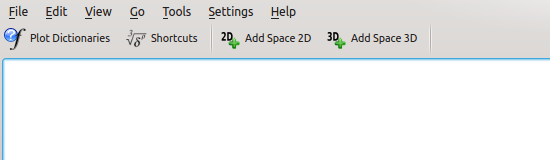
Khipu-Add Space 2D/3D
As mentioned above, Khipu draws functions in Space. So, there are two ways of adding a Space in Khipu based on the plot's dimension. When you are on the main window of Khipu (Dashboard in terms of Khipu's terminology), you will see a Main Toolbar which contains buttons of Add Space 2D and Add Space 3D. User can select either of them depending on the function he/she wants to plot.
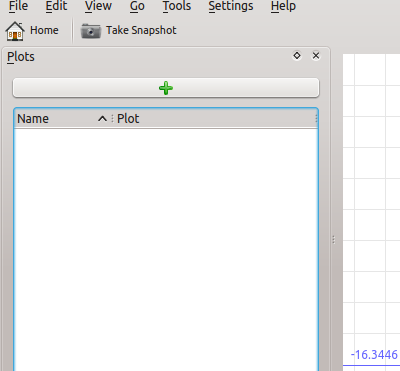
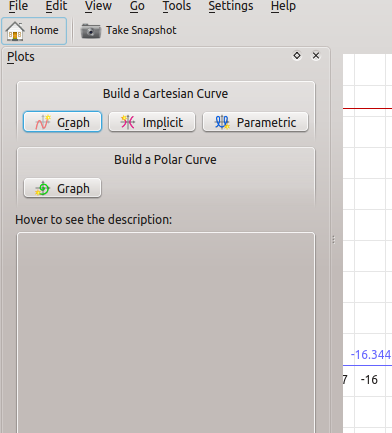
Khipu - Add Plot in Space
When the user clicks on , it will redirect to the 2D space UI. Then he/she needs to click on the green button which will let the user to add a plot. Then, user needs to select a plot's type (for example, click on Graph in Cartesian section if you want to plot a sine curve!) You can add a plot's name by checking the plot name's check box. Then, user has to add an appropriate equation (Analitza-type equation) to see it's plot. If you don't want anything else, just hit Enter. You can even set the color of the plot by changing the option from the list of colors given below and set an appropriate interval for the arguments of the function.
Khipu - 2D-Graph example
When the user clicks on , it will redirect to the 3D space UI. Then he/she needs to click on the green button which will let the user to add a plot. Then user needs to select a plot's type (for example, click on Graph in Cartesian section if you want to plot a simple surface!) You can add a plot's name by checking the plot name's check box. Then, user has to add an appropriate equation (Analitza-type equation) to see it's plot. If you don't want anything else, just hit Enter. You can even set the color of the plot by changing the option from the list of colors given below.
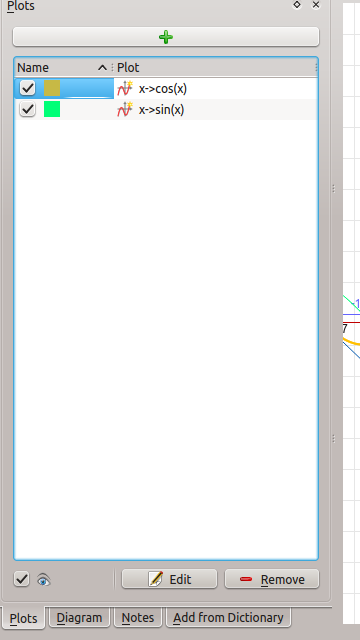
Khipu - Edit/Remove plots
User can edit or/and remove the already added plots.
You can edit a plot by just double-clicking on the plot's entry in the plots view or you can select the appropriate entry there and then click on the edit button shown below.