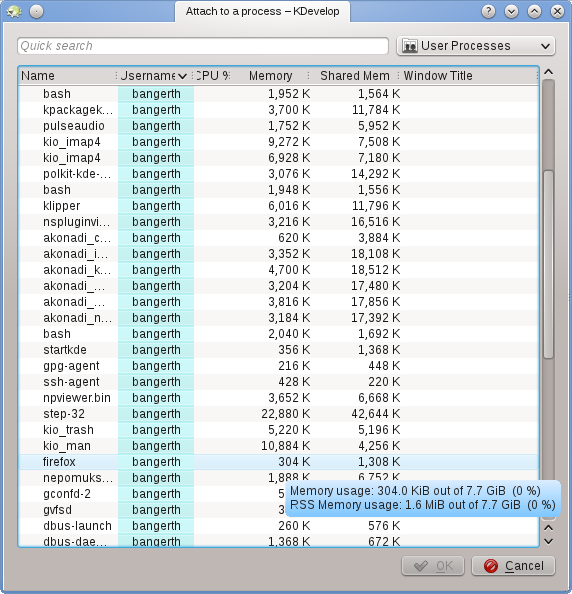
Sometimes, one wants to debug a program that's already running. One scenario for this is debugging parallel programs using MPI, or for debugging a long running background process. To do this, go to the menu entry → , which will open a window like the one above. You will want to select the program that matches your currently open project in KDevelop - in my case that would be the step-32 program.
This list of programs can be confusing because it is often long as in the case shown here. You can make your life a bit easier by going to the dropdown box at the top right of the window. The default value is User processes, i.e. all programs that are run by any of the users currently logged into this machine (if this is your desktop or laptop, you're probably the only such user, apart from root and various service accounts); the list doesn't include processes run by the root user, however. You can limit the list by either choosing Own processes, removing all the programs run by other users. Or better still: Select Programs only, which removes a lot of processes that are formally running under your name but that you don't usually interact with, such as the window manager, background tasks and so on that are unlikely candidates for debugging.
Once you have selected a process, attaching to it will get you into KDevelop's debug mode, open all the usual debugger tool views and stop the program at the position where it happened to be when you attached to it. You may then want to set breakpoints, viewpoints, or whatever else is necessary and continue program execution by going to the menu item → .