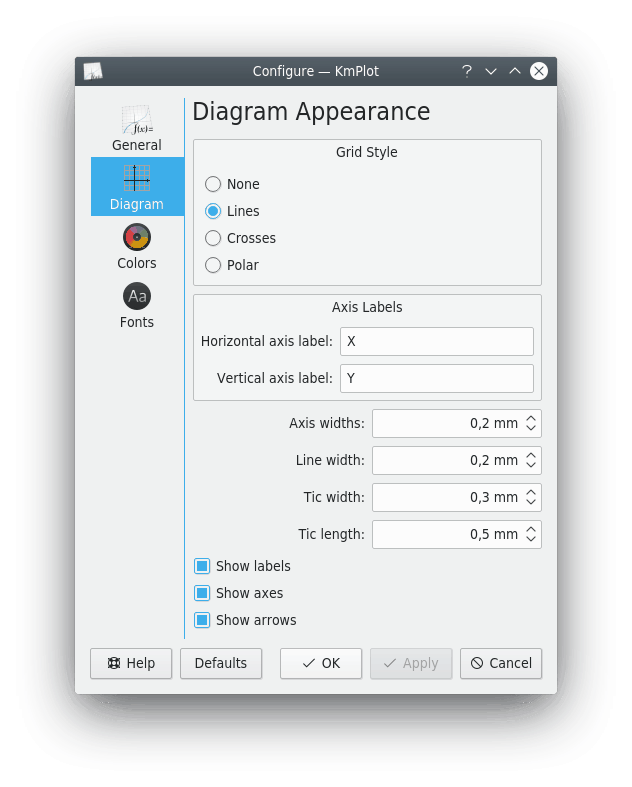
You can set the Grid Style to one of four options:
- None
No gridlines are drawn on the plot area.
- Lines
Straight lines form a grid of squares on the plot area.
- Crosses
Crosses are drawn to indicate points where x and y have integer values (e.g., (1,1), (4,2) etc.).
- Polar
Lines of constant radius and of constant angle are drawn on the plot area.
Other options for the diagram appearance can also be configured:
- Axis Labels
This section sets labels for the horizontal and vertical axes.
- Axis widths:
Sets the width of the lines representing the axes.
- Line width:
Sets the width of the lines used for drawing the grid.
- Tic width:
Sets the width of the lines representing tics on the axes.
- Tic length:
Sets the length of the lines representing tics on the axes.
- Show labels
If checked, the names of the axes are shown on the plot and the axes' tics are labeled.
- Show axes
If checked, the axes are visible.
- Show arrows
If checked, the axes are displayed with arrows at their ends.