To open this dialog select → from the menubar.
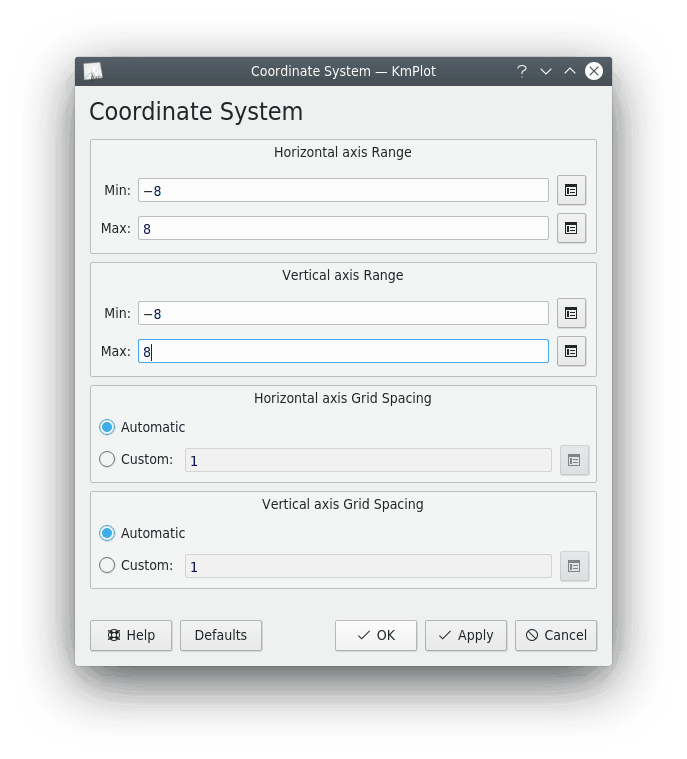
- Horizontal axis Range
Sets the range for the horizontal axis scale. Note that you can use the predefined functions and constants (see the section called “Predefined Function Names and Constants”) as the extremes of the range (e.g., set Min: to
2*pi). You can even use functions you have defined to set the extremes of the axis range. For example, if you have defined a functionf(x) = x^2, you could set Min: tof(3), which would make the lower end of the range equal to 9.- Vertical axis Range
Sets the range for the vertical axis. See “Horizontal axis Range” above.
- Horizontal axis Grid Spacing
This controls the spacing between grid lines in the horizontal direction. If Automatic is selected, then KmPlot will try to find a grid line spacing of about two centimeters that is also numerically nice. If Custom: is selected, then you can enter the horizontal grid spacing. This value will be used regardless of the zoom. For example, if a value of 0.5 is entered, and the x range is 0 to 8, then 16 grid lines will be shown.
- Vertical axis Grid Spacing
This controls the spacing between grid lines in the vertical direction. See “Horizontal axis Grid Spacing” above.