To draw a 3D graph with KAlgebra select the 3D Graph tab
and you will see an input field at the bottom where you will type your function.
Z cannot be defined yet. For the moment KAlgebra only supports
3D graphs explicitly dependent only on the x and y,
such as (x,y)->x*y, where z=x*y.
Examples:
(x,y)->sin(x)*sin(y)(x,y)->x/y
The view can be zoomed and moved with the mouse. Using the wheel you can zoom in and out. Hold the mouse button and move the mouse to rotate the graph.
The Left and Right arrow keys rotate the graph around the z axis, the Up and Down arrow keys rotate around the horizontal axis of the view. Press W to zoom in the plot and S to zoom it out.
In the menu you find these options:
: Save (Ctrl+S) the graph as image file or supported document
: Reset the view to the original zoom in the menu
You can draw the graphs with , or styles in the menu
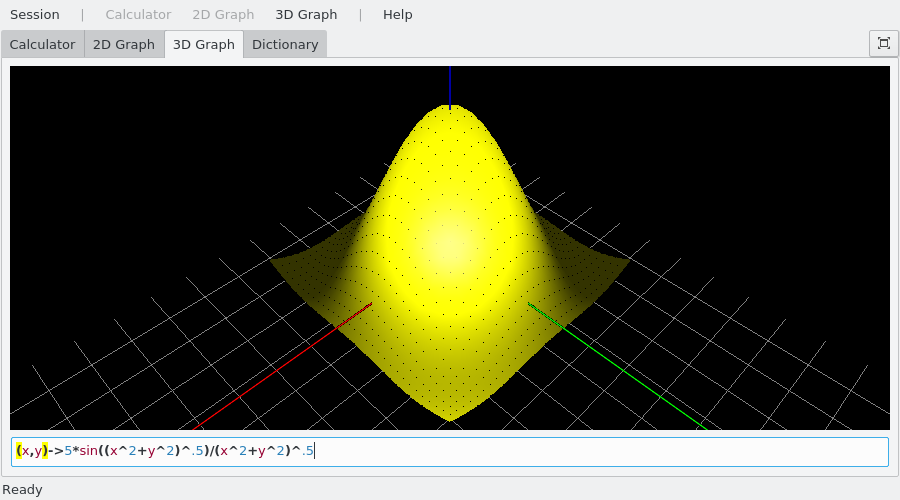
Below is a screenshot of the so-called “sombrero” function. This particular graph is shown using the 3D graph line-style.