You can configure the default reports or create your own from them by selecting 'New' and then configuring the new report. When you select 'Configure' you will be presented with the Report Tab. Initially, it is named the same as the old report with “(Customized)” added to the end. You can change the name to whatever you want. You can even name your custom reports the same as a default report, or the same as another custom report. Also, you can always use the Comment field to further distinguish reports.
The Report Configuration dialog has a number of tabs across the top. Each tab displays options for configuring different aspects of the report.
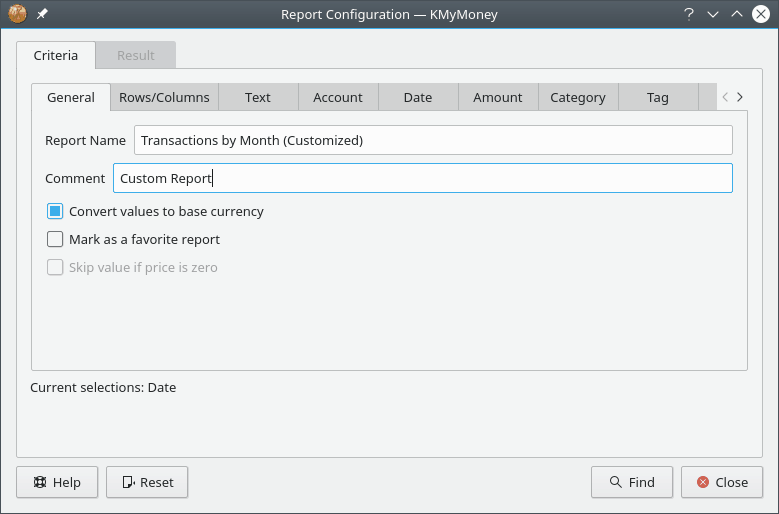
On this tab, you set the basic properties of this report.
Report Name: Choose a name for this report.
Comment: Enter a comment to help you remember the details of this report.
Convert values to base currency: Select this option to convert all values in the report to your base currency. Leave it unchecked if you'd like to see values in their original currency. If currencies are not converted, then subtotals will not be shown.
Mark as favorite report: Check this to cause this report to show up on the home page and in the group of Favorite Reports.
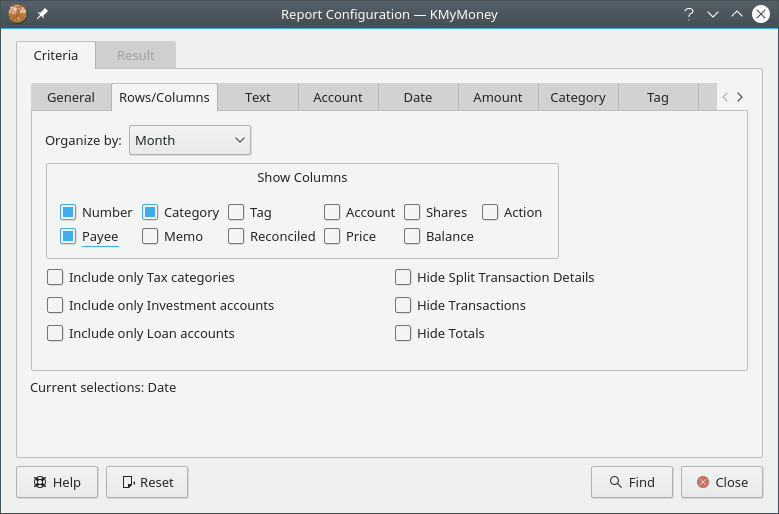
On this tab, you configure how you would like the rows and columns to be selected and organized. This tab presents different configuration options depending on the style of report you have selected.
For income/expense and net worth reports:
Columns: Choose how large of a time period each column should encompass
Rows: Choose what kind of accounts to display as the rows of this report
Detail: Choose the level of detail required for this report.
The following levels of detail are available:
All: Show every category or account.
Top-Level: Show only the highest-level categories or accounts, and roll up the sums of the subordinates categories or accounts into those values.
Groups: Show only the totals of the income, expenses, assets, or liabilities.
Total: Show only the grand totals line.
For transaction reports:
Organize by: Choose how to group the transactions in this report.
Show Columns: Choose which columns should be shown in the report. The date and transaction amount are always shown.
Include only Tax Categories: Only show categories which have been marked as tax-related.
Include only Investment Accounts: Only show transactions from investment accounts.
Include only Loan Accounts: Only show transactions from loan accounts.
This tab allows you to configure what the report should look like when it is displayed as a chart. See the Graphs & Charts section for more explanation of the charting functions.
Chart Type: The visual format of chart desired.
Show grid lines: Whether to print horizontal and vertical grid lines on the chart.
Draw values on chart: Whether to print the data values on the chart itself for chosen data points.
Show chart by default: Whether this report should first be displayed as a chart when it's opened.
Line width: The width of data lines on the chart.
The other tabs in this dialog are the same as in the Search Transactions interface. Please refer to the documentation on that interface for details on the other tabs.