Here is Kalzium the first time you run it, either by selecting → → → from the application starter or with Alt+F2 and entering kalzium into the input field.
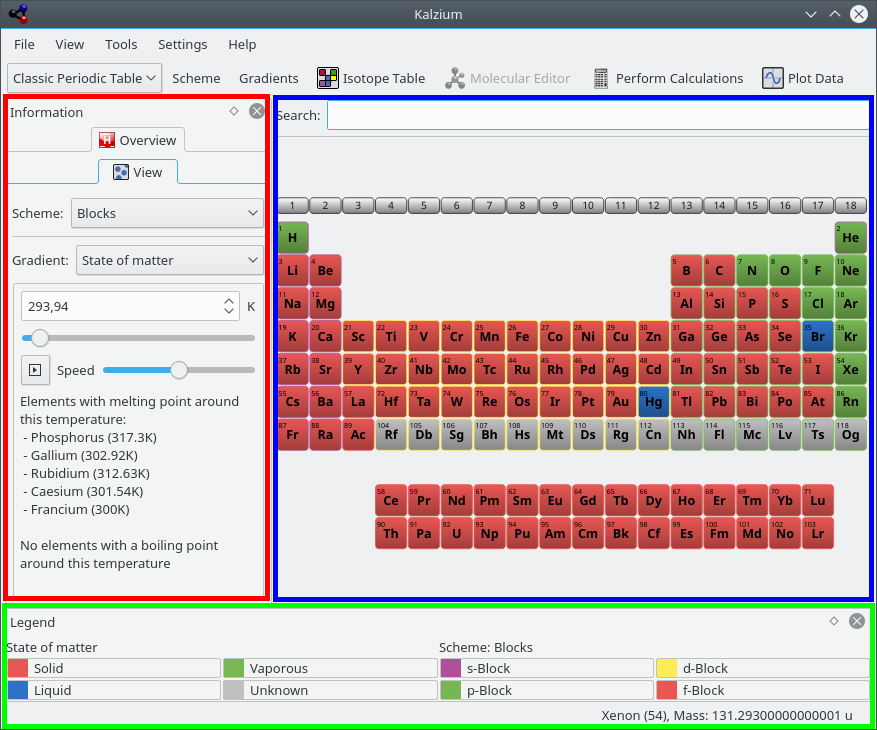
Kalzium is divided in an information panel on the left (in red), the table view (in blue) which shows the elements of the periodic table, and a legend panel at the bottom (in green). The standard menubar allows you to choose what you want to display and the status bar reports facts. The table view and the panels can be hidden using the corresponding items in menu. For example, you can hide the information panel with → .
When you move the mouse cursor on an element of the table, an overview of the current element is displayed in the Overview tab of the information panel.
You can choose several views for the table: classic periodic table, short periodic table, long periodic table, etc. It is also possible to change numeration scheme or display the elements per families, per groups, per crystal structure, depending on their acidic behavior, etc. You can change all that in the menu.
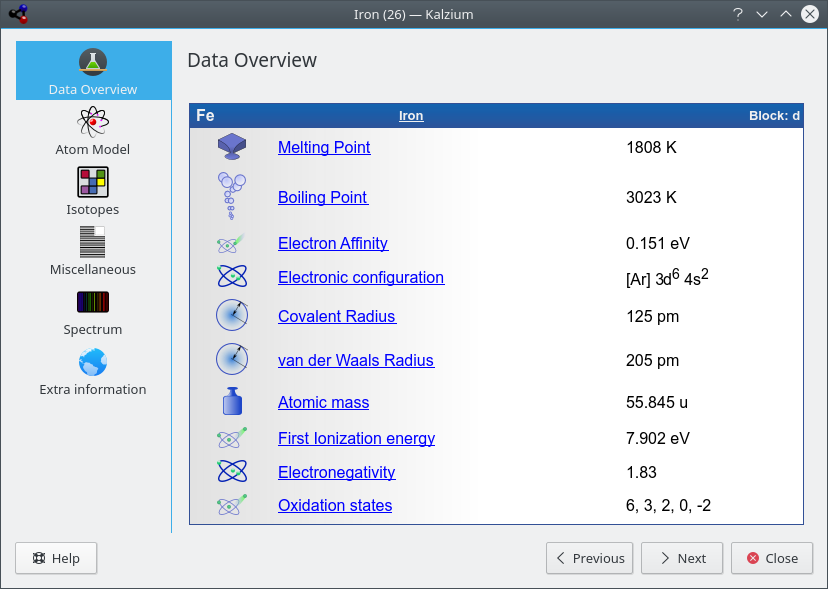
If you want to know facts about a precise element, click on it in the table and the information dialog will be displayed.
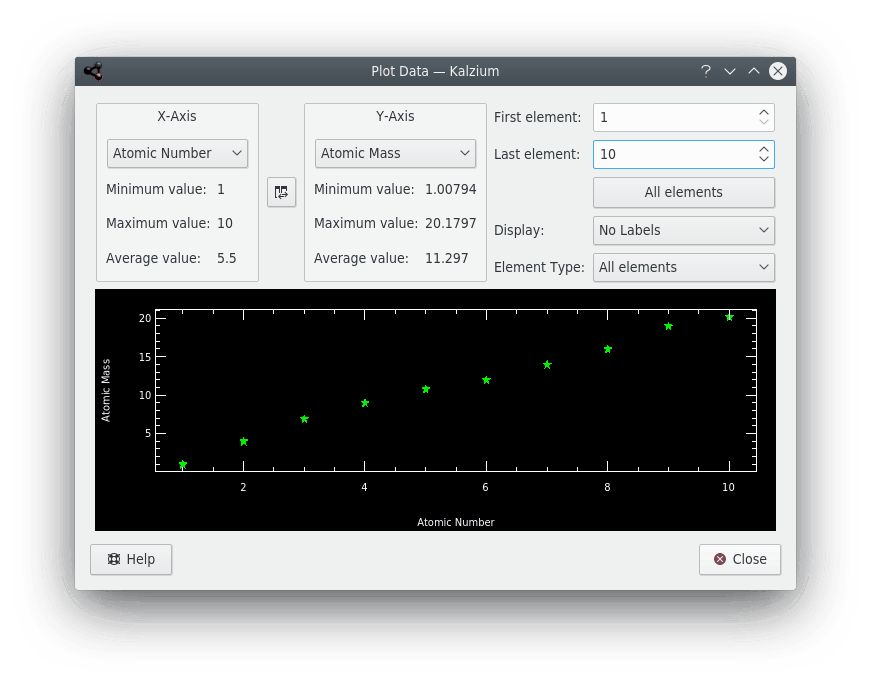
You can plot data using the → menu item. You choose what you want to plot on the y-axis and a range of elements to plot that for on the x-axis. The screenshot below shows the atomic mass of the elements 1 to 10. Click the  button between the axis panes to swap X and Y axes.
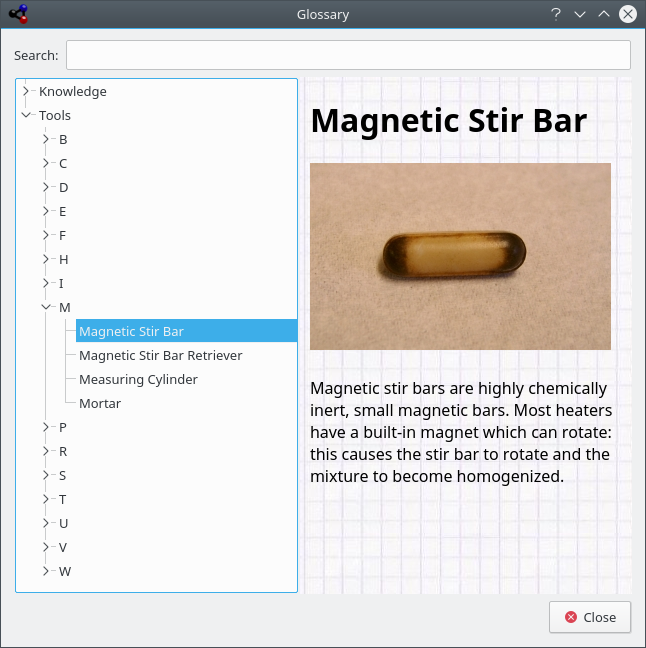
The Glossary ( → ) explains the most important chemical words and shows you pictures of the most common tools along with an explanation.