KDevelop understands source code, and as a consequence it is really good at providing you information about variables or functions that may appear in your program. For example, here is a snapshot of working with a piece of code and hovering the mouse over the symbol cell in line 1316 (if you are working keyboard oriented, you can achieve the same effect by holding down the Alt key for a while):
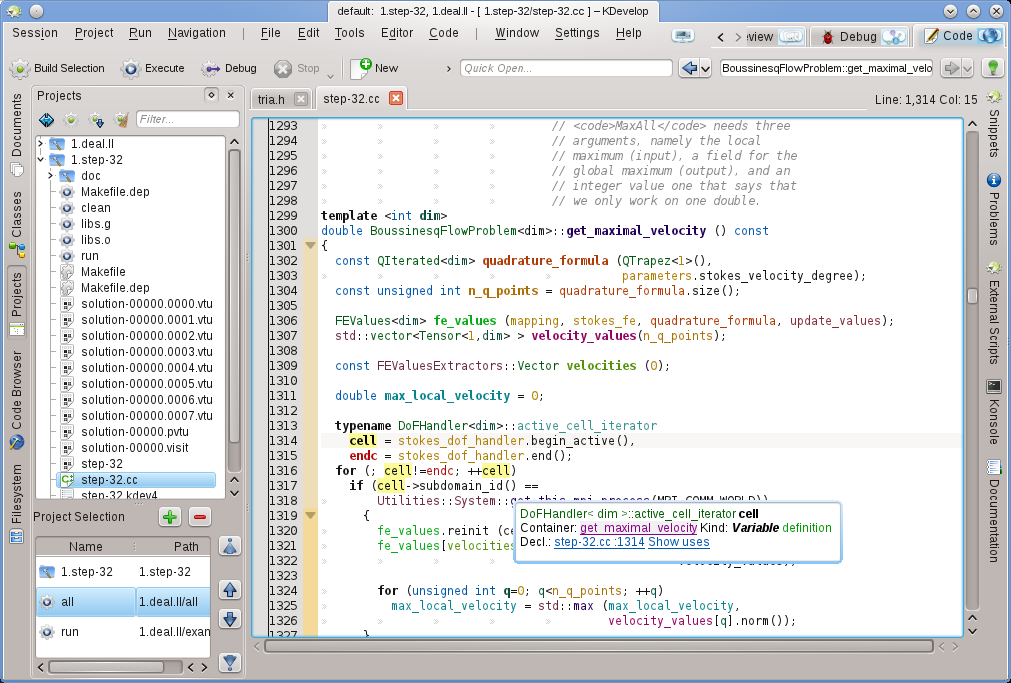
KDevelop shows me a tooltip that includes the type of the variable (here: DoFHandler<dim>active_cell_iterator), where this variable is declared (the container, which here is the surrounding function get_maximal_velocity since it is a local variable), what it is (a variable, not a function, class or namespace) and where it is declared (in line 1314, just a few lines up in the code).
In the current context, the symbol over which the mouse was hovering has no associated documentation. In this example, had the mouse hovered over the symbol get_this_mpi_process in line 1318, the outcome would have been this:
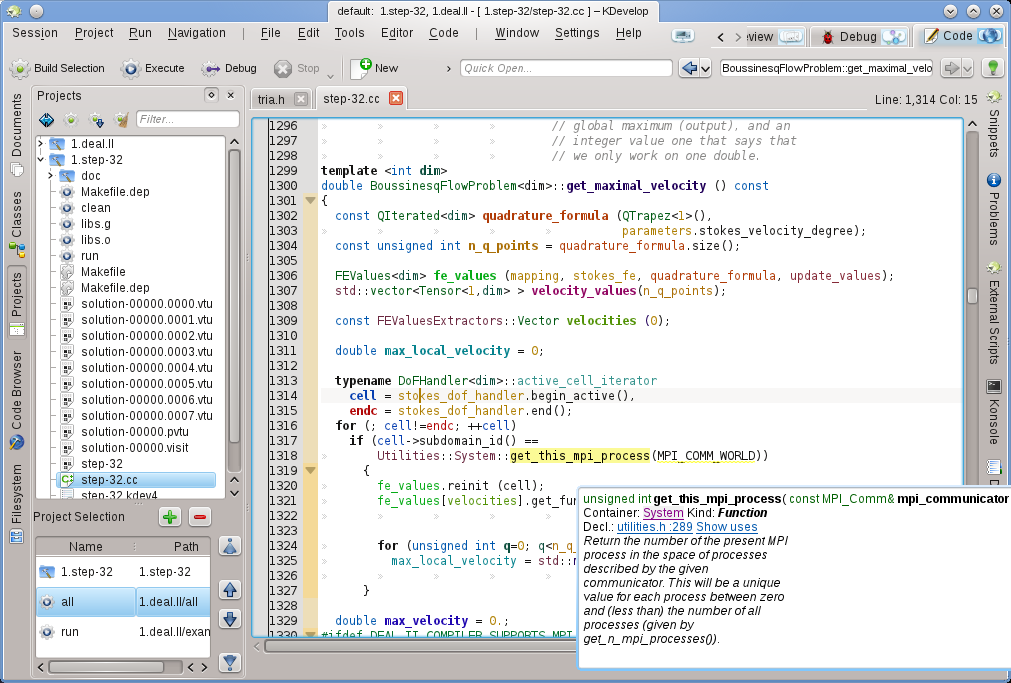
Here, KDevelop has cross-referenced the declaration from an entirely different file (utilities.h, which in fact even resides in a different project of the same session) together with the doxygen-style comment that accompanies the declaration there.
What makes these tooltips even more useful is that they are dynamic: I can click on the container to get information about the context in which the variable is declared (i.e. about the namespace System, such as where it is declared, defined, used, or what its documentation is) and I can click on the blue links that will reset the cursor position to the location of the declaration of the Symbol (e.g. in utilities.h, line 289) or give me a list of places where this symbol is used in the current file or throughout all the projects of the current session. The latter is often useful if you want to explore how, for example, a particular function is used in a large code basis.
Note
The information in a tooltip is fleeting — it depends on you holding the Alt key down or hovering your mouse. If you want a more permanent place for it, open the Code Browser tool view in one of the sub-windows. For example, here the cursor is on the same function as in the example above, and the tool view on the left presents the same kind of information as in the tooltip before:
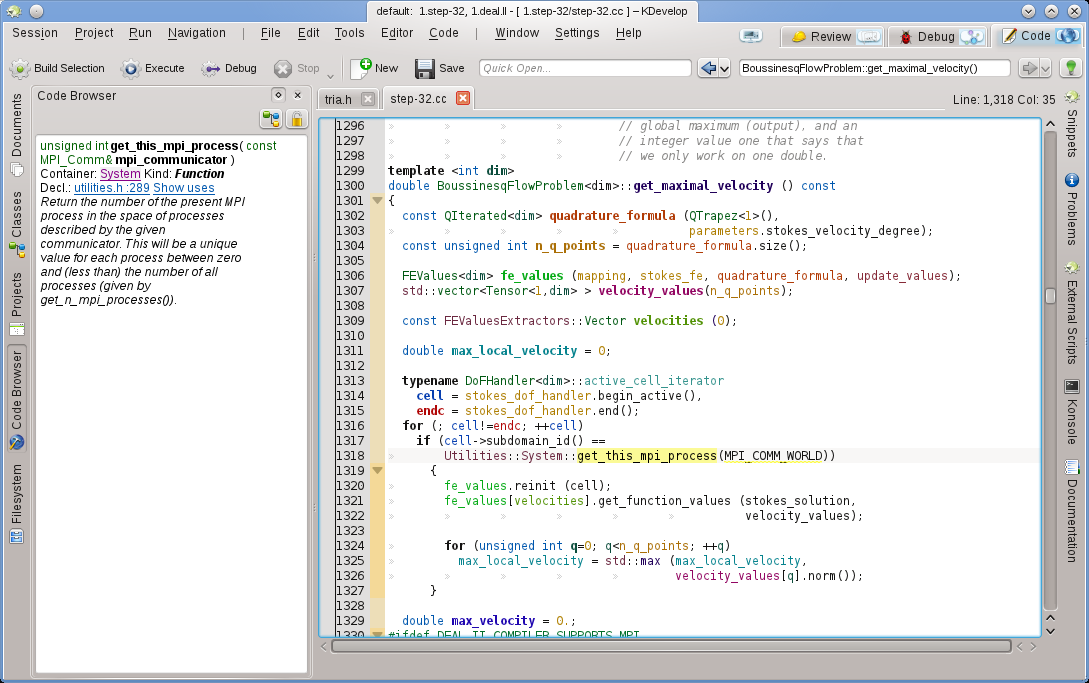
Moving the cursor around on the right changes the information presented on the left. What's more, clicking on the Lock current view button at the top right allows you to lock this information, making it independent of the cursor movement while you explore the information presented there.
Note
This sort of context information is available in many other places in KDevelop, not just in the source editor. For example, holding down the Alt key in a completion list (e.g. when doing a quick-open) also yields context information about the current symbol.
The next level up is to obtain information about the entire source file you are currently working on. To this end, position the cursor at file scope in the current file and look at the what the Code Browser tool view shows:
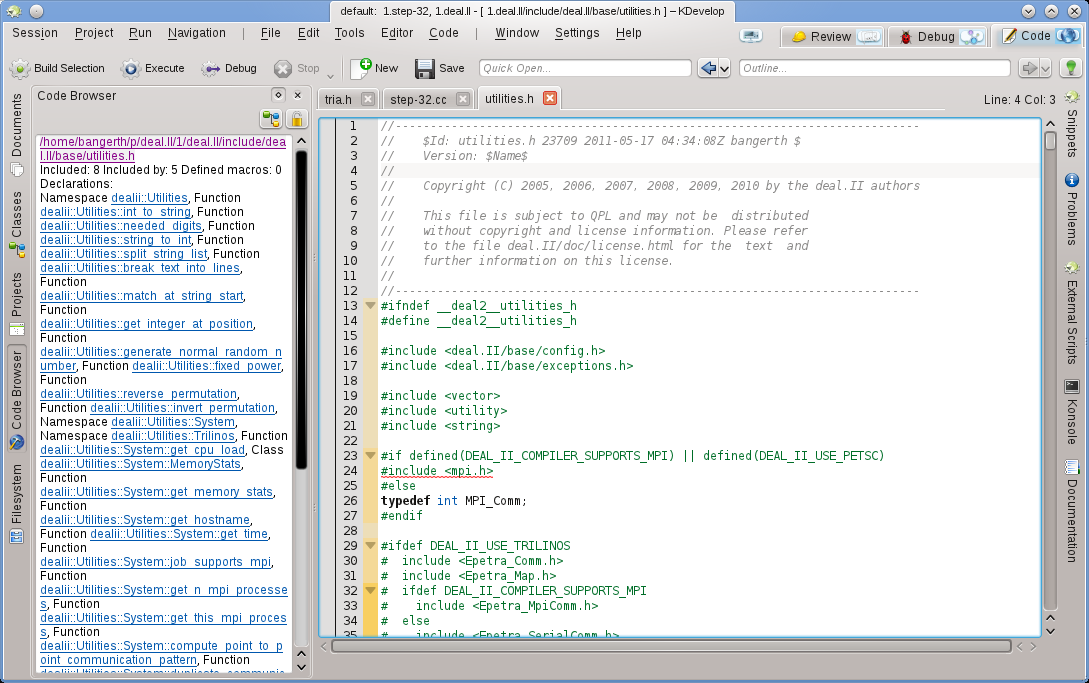
Here, it shows a list of namespaces, classes and functions declared or defined in the current file, giving you an overview of what's happening in this file and a means to jump directly to any of these declarations or definitions without scrolling up and down in the file or searching for a particular symbol.
Note
The information shown for file scope is the same as presented in the “Outline” mode discussed below for navigating source code; the difference is that outline mode is only a temporary tooltip.
There are many ways to obtain information about an entire project (or, in fact, about all projects in a session). This sort of information is typically provided through various tool views. For example, the Classes tool view provides a tree structure of all classes and surrounding namespaces for all projects in a session, together with the member functions and variables of each of these classes:
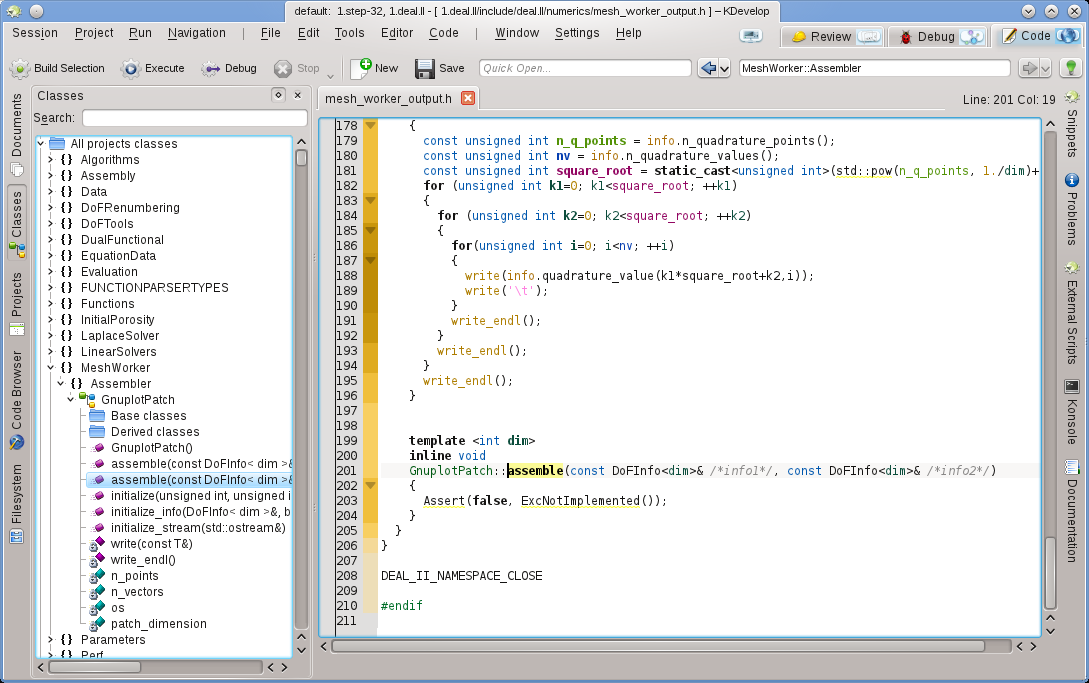
Hovering over an entry provides again information about the symbol, its location of declaration and definition, and its uses. Double-clicking on an entry in this tree view opens an editor window at the location where the symbol is declared or defined.
But there are other ways of looking at global information. For example, the Documents tool provides a view of a project in terms of the kinds of files or other documents this project is comprised of:
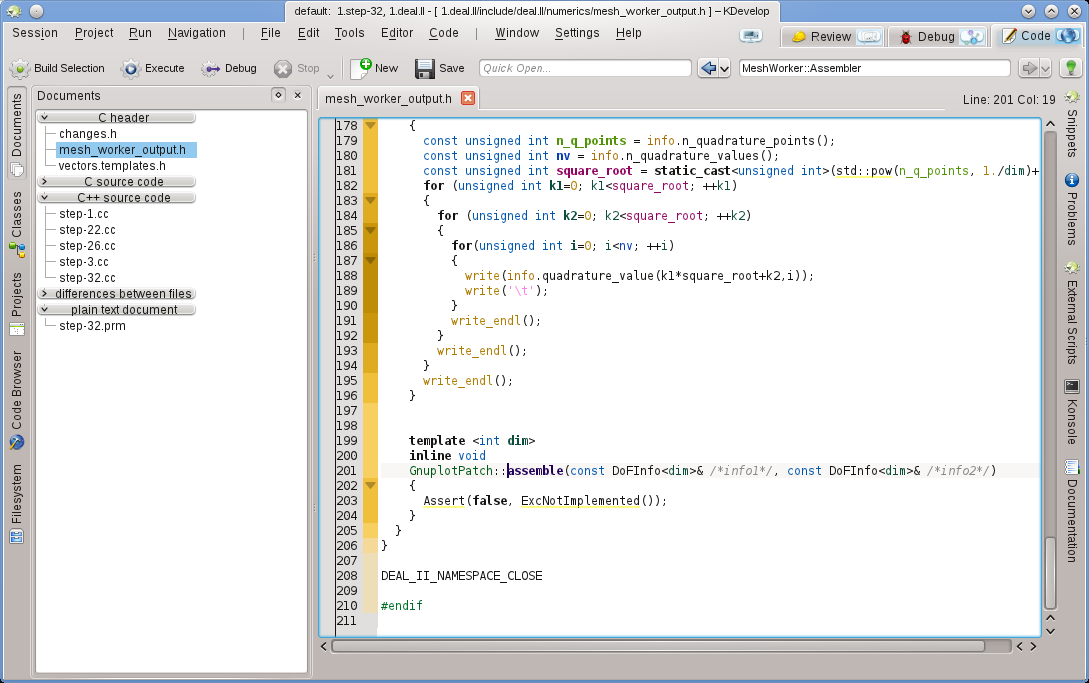
KDevelop uses a variety of colors to highlight different objects in source code. If you know what the different colors mean, you can very quickly extract a lot of information from source code just by looking at the colors, without reading a single character. The highlighting rules are as follows:
Objects of type Class / Struct, Enum (the values and the type), (global) functions, and class members each have their own color assigned (classes are green, enums are dark red, and members are dark yellow or violet, (global) functions are always violet).
All global variables are colored in dark green.
Identifiers which are typedefs for another type are colored in teal.
All declarations and definitions of objects are in bold.
If a member is accessed from within the context where it is defined (base or derived class) it appears in yellow, otherwise it appears in violet.
If a member is private or protected, it gets colored in a slightly darker color when used.
For variables local to a function body scope, rainbow colors are picked based on a hash of the identifier. This includes the parameters to the function. An identifier always will have the same color within its scope (but the same identifier will get a different color if it represents a different object, i.e. if it is redefined in a more nested scope), and you will usually get the same color for the same identifier name in different scopes. Thus, if you have multiple functions taking parameters with the same names, the arguments will all look the same color-wise. These rainbow colors can be turned off separately from the global coloring in the settings dialog.
Identifiers for which KDevelop could not determine the corresponding declaration are colored in white. This can sometimes be caused by missing
#includedirectives.In addition to that coloring, the normal editor syntax highlighting will be applied, as known from Kate. KDevelop's semantic highlighting will always override the editor highlighting if there is a conflict.